Sunday, October 13, 2013

How High Was Phailin's Storm Surge?

How high was Phailin's storm surge? Some storm surge observations from different locations are just starting to be reported, but it may be days or weeks or until we have a full assessment of maximum surge levels.

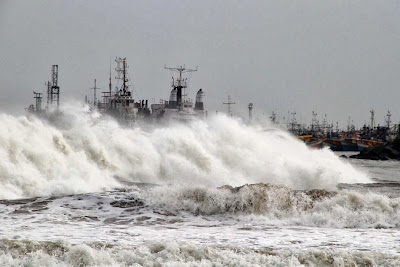
Tropical Cyclone Phailin generated a large storm surge and destructive waves along the coast of India. Image source: http://www.abc.net.au/news/image/5018642-3x2-940x627.jpg


That said, a few observations are just starting to come in...

An article from the BBC states...

"The Times of India reported that a storm surge more than 3m (9ft) high had inundated areas of Ganjam, Khurda, Puri and Jagatsinghpur districts of Orissa and the Srikakulam district of Andhra Pradesh." See: http://www.bbc.co.uk/news/world-asia-india-24510464

Also, the closest INCOIS tide gauge, located in Paradeep, which is well east of the area of peak surge, has reported surge levels exceeding one meter. The graphic below provides water levels from the past 24 hours. The top graphic depicts observed water levels (dots) compared to astronomical tide levels (if there were no storm). The difference between these two levels is essentially a storm surge, and often called a residual, on such graphs.

Note that between 0900 and 1000 UTC, some residual levels exceeded 1.5 m. However, these high values may include some wave action, so they may not be purely storm surge levels.


Observed water levels vs. astronomical tide levels for the past 24 hours at Paradeep, India. Source: http://tsunami.incois.gov.in/ITEWS


Residual water levels from the past 24 hours at Paradeep, India. These levels represent the difference between observed water levels and astronomical tide levels, and essentially represent storm surge observations. Source: http://tsunami.incois.gov.in/ITEWS

Please send any storm surge observations from this storm to me by:
1) Replying to this or other blog posts
2) Sending me a tweet at @hal_needham
3) Emailing me at hal@srcc.lsu.edu

Thank you so much and stay safe, everybody!
-Hurricane Hal

Saturday, October 12, 2013

Phailin Made Landfall as a Category-4 Tropical Cyclone; Onshore Hurricane-Force Winds Still Generating a Massive Surge

Tropical Cyclone Phalin made landfall on Oct 12 around 1330 UTC, or about 1900 local time. A wind profile produced by NOAA at 1200 UTC, just before landfall, placed the maximum sustained winds at the time of landfall around 122 knots, or 140 MPH, which made the storm a category-4 tropical cyclone at landfall.

A NOAA wind profile map indicates Phailin was a category-4 tropical cyclone just before landfall. Source: http://www.ssd.noaa.gov/PS/TROP/mtcswa.html?storm=IO022013&id=PHAILIN&timeDiff=6

Although the center of circulation is now over land, the storm continues to generate hurricane-force winds that are blowing onshore to the east of the circulation center. This is certainly continuing to pile up storm surge along the coast near and to the east of Gopalpur. Storm surge inundation often lasts for many hours, especially if strong onshore winds persist.

The map below depicts wind profiles as of 1800 UTC. The contour lines show wind speed in knots. The area shaded in yellow contains wind speeds of greater than 35 knots, or approximately 40 MPH (tropical storm strength), while the area within the 65-knot contour is essentially experiencing hurricane force winds in excess of approximately 74 MPH.

As of 1800 UTC, Phalin's center of circulation is inland, but hurricane-force winds continue to blow onshore, perpetuating coastal flooding east of Gopalpur. Source: http://www.ssd.noaa.gov/PS/TROP/mtcswa.html?storm=IO022013&id=PHAILIN&timeDiff=0

Phailin Approaches Landfall near the Orissa/ Andhra Pradesh Border

Tropical Cyclone Phailin is approaching landfall near the border of Orissa and Andhra Pradesh. Track the movement of the eye on Brian McNoldy's radar website at: http://andrew.rsmas.miami.edu/bmcnoldy/tropics/radar/

Tropical Cyclone Phailin approaches landfall, as seen on this radar image from Brian McNoldy at the Univ of Miami

Expect the highest storm surge levels to occur to the northeast of the point of landfall. The region of peak surge will most likely extend from Ichchapuram to Puri, however, coastal flooding will occur along the coast for hundreds of kilometers. Surge levels may be particularly high near the coastal community of Gopalpur, east of Brahmapur.

Friday, October 11, 2013

NOAA Website Provides Excellent Wind Profile Maps of Tropical Cyclone Phailin

The National Oceanic and Atmospheric Administration's Multiplatform Tropical Cyclone Surface Winds Analysis (MTCSWA) website is providing excellent wind profile maps of Tropical Cyclone Phailin. These maps also provide important data related to the minimum central pressure, maximum sustained wind speed, and tropical cyclone size, updated every six hours. This website is located at: http://www.ssd.noaa.gov/PS/TROP/mtcswa.html?storm=IO022013&id=PHAILIN&timeDiff=0.

NOAA's MTCSWA Website is providing excellent wind profile maps of Tropical Cyclone Phailin.

The latest wind profile map was made available on 12 Oct 2013 at 0000 UTC, or slightly more than three hours ago. This map depicts the area covered by various wind velocities, reported in knots (nautical miles per hour). The area of 34-knot winds, which approximately convert to tropical-storm-force winds (about 40 MPH), were just coming onshore in this latest map. Various sources have predicted Phailin's landfall to occur around 1200 UTC, or about 12 hours after the time of these mapped observations.

The text provided below this map provides important information about tropical cyclone size, maximum sustained wind speeds and minimum central pressure. The maximum wind speed of 138 kts converts to 158 MPH, which still places Phailin above the threshold for a category-5 tropical cyclone, according to the Saffir Simpson Hurricane Wind Scale.

Minimum central pressure is now around 897 hPa, which is extremely low for a tropical cyclone. The past advisory placed the pressure at an insane 883 hPa. Lower pressure in tropical cyclones generally means more intense wind speeds. These pressures would place Phailin among an elite class of the most powerful tropical cyclones to ever develop on the face of the earth. Typhoon Tip is generally regarded as the most intense tropical cyclone in history and the minimum central pressure in that storm was 870 hPa, or only 13 hPa lower than Phailin. The lowest central pressure of any tropical cyclone to strike the U.S. was 892 in the 1935 Labor Day Hurricane, followed by 909 mb in Hurricane Camille. Both storms were small, compact hurricanes that made landfall as category-5 hurricanes in the U.S.

The RMW value of 11 nm refers to the radius of maximum winds, which is a measure of the distance from the center of circulation to the strongest winds in nautical miles. More powerful tropical cyclones tend to have smaller RMW sizes. In comparison, the RMW size of Hurricane Camille was 8 nm, while the RMW size for the Labor Day Hurricane was only 6 nm. These were some of the smallest RMW values of any hurricanes to ever strike the U.S.

Finally, the small table of values on the bottom left refer to the radius of 34-kt, 50-kt and 64-kt winds to the northeast, southeast, southwest and northwest of the storm center. The 34-kt winds convert to tropical-storm-force winds (approx 40 MPH) and 64-kt winds convert to hurricane-force winds (approx 74 MPH). The size of these wind swaths appears to have increased steadily over the past 18 hours. Now the radius of 64-kt winds extends out 55 nm and the radius of 34-kt winds extends out 150 nm from the center of circulation. These values are very close to the average size values we found in recent storm surge study conducted for the U.S. Gulf Coast.

SCIPP is very close to completing two cutting-edge studies that use robust tropical cyclone size and wind data, as well as data from SURGEDAT, the world's most comprehensive storm surge database, to better understand how tropical cyclone size and winds influence storm surge heights. Without spoiling the end of the movie for you, I will tell you that we found both pre-landfall tropical cyclone wind speeds and storm size significantly influence surge heights. In other words, both the pre-landfall maximum sustained wind speeds and the storm size are important for generating storm surge, which is why the information on this NOAA website is very useful for better understanding the variety of wind and surge hazards that Phailin could produce.

Follow Near Real-Time Water Levels in India on the INCOIS Website

Follow near real-time water levels in India on the INCOIS website. ( Link: http://tsunami.incois.gov.in/ITEWS/RealTimeData.do?function=getRealTimeData&redirect=false#btm). Although no tide gauges are provided for the likely area of peak storm surge (they would probably be washed away anyway), a gauge in Paradeep, about 150 km (93) miles northeast of the likely peak surge location, provides near real-time data.

Source: http://tsunami.incois.gov.in/ITEWS/RealTimeData.do?function=getRealTimeData&redirect=false#btm

The top graph provides water level observations (red dots), as well as predicted tide levels (green curve). The bottom graph provides the residual level, or the difference between observed and predicted water levels, which is essentially a storm surge height. As of 11 Oct at 1900 UTC, the storm surge level in Paradeep was approximately 70 cm, and rising.

Surge levels in the region of peak storm surge will likely be substantially higher than Paradeep, because storm surge levels tend to be quite localized. Water levels on the Indian coast should peak about the time of landfall, which will be on 12 Oct around 1200 UTC, although localized differences in the timing of peak surge often occur in landfalling tropical cyclones.

Tropical Cyclone Phailin Radar Loop from Brian McNoldy

Hello everyone-

Please visit the following link for a great Tropical Cyclone Phailin radar loop provided by Brian McNoldy at the University of Miami:

http://andrew.rsmas.miami.edu/bmcnoldy/tropics/radar/


This radar loop provided by Brian McNoldy at the University of Miami will enable viewers to track TC Phailin

As the India Meteorological Department website may get bogged down with traffic, Brian's site may provide quicker service. The radar loops are centered on Visakhapatnam, which is located to the southwest of the projected landfall location.

Important Update to Previous Post

Hello everyone-

I just provided an important update to the previous post. I included wind/ surge information for the three U.S. Gulf Coast storms (Camille, Katrina and Carla) that had wind speeds exceeding 140 kts (161 MPH) at 18 hours before landfall. All of these storms produced at least 6.71 m (22 ft) storm surges/ storm tides.

Please see previous post again...

India Meteorological Department Likely Understimating Phailin's Storm Surge Potential

The India Meteorological Department is likely underestimating Tropical Cyclone Phailin's storm surge potential. Phailin is currently on the threshold of a category-4/ category-5 tropical cyclone and is moving towards the coast of Odisha in India. The Joint Typhoon Warning Center predicts that Phailin will slighly intensify and become a category-5 tropical cyclone before making landfall, in approximately 20 hours.

Although the latest statement from the India Meteorological Department (IMD) does not list a current intensity for Phailin, IMD predicts the peak wind speed to reach only around 116 kts (134 MPH), which would make this system a weak category-4 tropical cyclone on the Saffir-Simpson Hurricane Wind Scale. Also, the IMD estimates that Phailin has the potential to generate a 3-meter storm surge near and to the northeast of the landfall location.

 Tropical Cyclone Phailin will likely approach the coast of Odisha in India as a category-5 tropical cyclone, and generate a devastating storm surge. Image credit: NOAA/ Accuweather

Even if the lower intensity forecast is accurate, IMD is likely underestimating the storm surge potential for this dangerous storm. SCIPP has recently conducted a correlation analysis to better understand the relationship between pre-landfall tropical cyclone winds and storm surge heights. Along the U.S. Gulf Coast, this study found that 116-kt (134 MPH) pre-landfall winds, measured at 18 hours before landfall, would generally produce a storm surge of around 3.5 meters (11.5 feet), with higher surge heights produced by storms with larger wind fields, and smaller surges produced by storms with smaller wind fields. However, the Bay of Bengal tends to have shallower bathymetry (water depth) than the Gulf of Mexico, so generally, we would expect surge heights for comparative storms to be slightly higher in India. Given the pre-landfall intensity, the water depth, and the relatively small (but fluctuating) size of Phailin's 64-kt wind field, we might expect a storm surge height of around 4 m if this lower wind intensity forecast is accurate.

However, the Joint Typhoon Warning Center, and other weather information sources, like the Weather Underground, support the more intense forecast that classifies Phailin as a category-5 tropical cyclone as it approaches the coast. The Joint Typhoon Warning Center predicts a maximum wind speed of between 140 kts (161 MPH), around 24 hours before landfall, with an intensity of 145 kts (167 MPH) at 12 hours before landfall. Such intense pre-landfall wind speeds (> 140 kts or 161 MPH) have only been exceeded three times in our U.S. Gulf Coast storm surge history, and all three of these storms produced at least 6 m storm surges. Here is a list of those storms and the type of storm surge they produced....

 Storm Name    Year     Wind Speed 18 hrs before landfall     Surge/ Storm Tide Height

Camille            1969                159 kts (183 MPH)                7.5 m (24.6 ft) storm tide

Katrina            2005                148 kts (170 MPH)                8.47 m (27.8 ft) storm surge

Carla               1961                145 kts (167 MPH)                6.71 m (22 ft) storm tide

Phailin              2013               142 kts (163 MPH) *forecast         ???


Given the shallow water of the Bay of Bengal, we may expect a 6 m (20 ft) storm surge from Phailin, even if the size of the wind field with this storm is relatively small.

All people in the coastal zone near and to the northeast of the landfall location should be evacuated immediately. Although the IMD did call for coastal evacuations, the advice on the latest bulletin that states, "people in affected areas to remain indoors during cyclone landfall," may prove to be catastrophic and life-threatening. (see: http://www.imd.gov.in/section/nhac/dynamic/cwind.pdf) IMD is likely underestimating the catastrophic nature of this impending storm surge event, which will likely wash away most structures on low-lying ground in the area of peak storm surge heights.


What a 6-Meter (20 foot) Storm Surge Can Do

Source: http://somethingsublime.typepad.com/something_sublime_from_th/2008/09/after-ike.html

Tropical Cyclone Phailin has the potential to generate a surge at least 6 meters (20 feet) high. This surge height would be comparable to the storm surge generated by the Galveston Hurricane of 1900. This storm devastated Galveston Island, Texas, killing between 6,000 and 8,000 people in the deadliest natural disaster in U.S. history.

These photos show the damage produced by this surge. The damage was especially catastrophic because Galveston had little flood protection. Unprotected areas along the Odisha coastline in India may experience similar levels of damage in the next 24 hours.

 Source: http://www.flickr.com/photos/briscoe_center/6170146736/

Catastrophic Storm Surge Imminent along Indian Coast

Tropical Cyclone Phailin tracking map provided by the Joint Typhoon Warning Center

 A catastrophic storm surge is imminent along the Indian Coast. At 0600 UTC this morning, the Joint Typhoon Warning Center placed the intensity of this storm at 135 kts (155 MPH), which puts it on the threshold between a category 4 and 5 tropical cyclone on the Saffir-Simpson Hurricane Wind Scale. Some slight intensification is forecast overnight (local time), so this storm should become a category-5 tropical cyclone.

It appears as though the intensity forecast has dropped off very slightly from the previous statement, but, in exchange the size of strong winds is forecast to increase, which could mean a larger storm surge overall. At 1800 UTC today, which should be approximately 18 hours before landfall, the storm is forecast to produce 140-kt winds (161 MPH), with a 35 nm radius of 64-kt winds. This means that hurricane-force wind speeds should extend about 35 nm from the center of circulation.

SCIPP has conducted multiple research projects that have proven that storm surge correlates better with tropical cyclone characteristics, like wind speed and storm size, before landfall than at landfall. The storm conditions 18 hours before landfall tend to correlate best with storm surge heights. This means essentially that a catastrophic storm surge is a certainty given the forecast intensity and size at 18 hours before landfall. Even if the cyclone suddenly started to weaken six hours from now (16 hours before landfall), a devastating storm surge would have already been set in motion.

This size is still a bit on the small size, but the very intense wind speeds should still enable Phailin to produce a devastating storm surge. Remember that in U.S. history, we've had several small, but intense, hurricanes that generated catastrophic surges. In 1900, the Galveston Hurricane generated a 6.1-meter (20 foot) surge along the Texas coast. Although it was a relatively small storm, it was classified as a category-4 hurricane 18 hours before landfall. The 1935 Labor Day Hurricane was one of the smallest hurricanes to strike the U.S., but it produced a 5.49- meter (18 foot) surge in the Florida Keys. It was a category-4 hurricane 18 hours before landfall and strengthened into the first category-5 hurricane to make landfall in the U.S. Hurricane Camille in 1969 was also a relatively small storm, but generated a massive 7.5-m (24.6 foot) surge along the Mississippi Coast.

Given the intense pre-landfall winds, shallow bathymetry, and the increased forecast area of 64-kt winds, one would have to estimate that this storm has the potential to generate a 6-meter (approx 20 foot) surge. This means the sea level would rise by 6 m (20 ft), accompanied by destructive waves that would ride ON TOP OF this massive storm surge.

Precautions/ evacuations should be taken immediately near and to the northeast of the forecast landfall location.

Thursday, October 10, 2013

Phailin's Storm Surge Could Reach at least 5-6 Meters

Tropical Cyclone Phailin's Forecast Track. Source: Joint Typhoon Warning Center

Tropical Cyclone Phailin's Forecast Track. Source: Weather Underground


The Joint Typhoon Warning Center forecasts TC Phailin to approach the coast of India, near southwest Odisha, and make landfall around 0900 UTC on Saturday, October 12th. This would be during the Saturday afternoon in India.

SCIPP has found that storm surge heights correlate better with pre-landfall wind intensity than with the wind speed at landfall. Wind speeds 18 hours before landfall correlate best with surge heights. Also, pre-landfall tropical cyclone size tends to correlate better with surge heights than tropical cyclone size at landfall.

That said, I investigated the Joint Typhoon Warning Center forecast for October 11th at 1500 UTC, which would be approximately 18 hours before landfall. The wind forecast is grim indeed, with maximum sustained winds forecast to exceed 140 knots (161 MPH). In an analysis we've recently conducted on 117 historical surge events along the U.S. Gulf Coast, only four events exceeded 140 knots at 18 hours before landfall. A regression analysis shows that the typical surge height produced by a storm with this wind speed (averaging bathymetry, storm size, etc.) would be around 5-6 meters (17-20 feet).

Some discrepancy exists related to the size of Phailin. According to the Capital Weather Gang's recent blog post, Ryan Maue, of Weatherbell.com, stated, "It's equivalent to Katrina in size." (see: http://www.washingtonpost.com/blogs/capital-weather-gang/wp/2013/10/10/potentially-catastrophic-cyclone-phailin-headed-for-india/.)

However, the Joint Typhoon Warning Center provides a wind swath forecast as follows for the approximate time of 18 hours before landfall:
Radius of 64-kt wind: 25 nm
Radius of 50-kt wind: 40 nm
Radius of 34-kt wind: 95 nm

These dimensions are quite small. By comparison, we recently found that the average size of 64-kt winds was around 61 nm for tropical cyclones since 1988, for which we had accurate storm surge data. Hurricane Katrina was generating 64-kt winds out to 90 nm and Ike was producing 64-kt winds out to 105 nm at 18 hours before landfall. Hurricane Charley was considered a small tropical cyclone, with 64-kt winds only out to 20 nm at landfall, and this storm size may be fairly close to Phailin, if the Joint Typhoon Warning Center forecast is correct. Tropical cyclones with this size generally produced storm surges of approximately 2 meters along the U.S. Gulf Coast.

The Bay of Bengal tends to be very shallow, which helps to increase surge heights and make them generally even higher than along the U.S. Gulf Coast. This shallow bathymetry may essentially cancel out the small storm size and generally produce a storm surge that is similar to the typical height along the Gulf Coast for a storm of this intensity (5-6 meters or 17-20 feet). However, if this storm does turn out to be geographically large and hold it's intensity, we could see an even more catastrophic storm surge that exceeds 8 meters (around 26 feet).

We can only hope that people in this storm's path will take precautions and seek safe shelter or evacuate the region of peak storm surge. We will hope and pray that everyone will hear and heed the warnings for this catastrophic surge event.


Tropical Cyclone Phailin will Bring Catastrophic Storm Surge to India

NOAA infrared satellite image of Tropical Cyclone Phailin. Source: The Washington Post Capital Weather Gang: http://www.washingtonpost.com/blogs/capital-weather-gang/wp/2013/10/10/potentially-catastrophic-cyclone-phailin-headed-for-india/

The Bay of Bengal has been the home of the most catastrophic storm surge disasters on the planet. This basin, which is relatively small by global comparison, has experienced 15 of the 21 tropical cyclones that have killed at least 5,000 people (Dube et al. 1997). Storm surge is the main reason for these high fatality totals. In an 11-year period from 1960-1970, this basin observed seven storm surge events that exceeded the height of Hurricane Katrina's surge in 2005. Storm surges generated from tropical cyclones have killed as many as 300,000 people in 1737 and again in 1970 (Dube et al. 1997).

SCIPP has identified the location and height of 57 peak storm surges in the Northern Indian Ocean, 53 of which occurred along the shores of the Bay of Bengal. This work was conducted as part of a global assessment of surge observations and impacts. The highest surge level occurred in 1876 in Bangladesh, when a surge topped out at around 13.7 meters (45 feet). The area most likely to be impacted by Phailin's surge, along the coast of Odisha, has previously experienced several high surges, including a 7.5 meter surge in October 1999 near Paradip, and a 5 meter storm tide in October 1971.

This region tends to experience so many catastrophic storm surges for several reasons. One reason is that intense tropical cyclones sometimes form in this region, fueled by warm ocean waters, yet far enough from the equator to get the spin needed for tropical cyclone development from the Coriolis Effect. Also, the Bay of Bengal is a shallow water basin with a semi-enclosed shape. These factors exacerbate storm surge heights because water essentially gets trapped and displaced water has no where to go but "up." Another reason these surges are so catastrophic is because of the high population density along the coasts of India and Bangladesh.

Tropical Cyclone Phailin has rapidly intensified as it moves across the Bay of Bengal in the direction of India. According to the Joint Typhoon Warning Center, the storm now has maximum sustained winds of 135 knots, which places it on the cusp of becoming a category-5 hurricane according to the Saffir-Simpson Hurricane Wind Scale. The Joint Typhoon Center anticipates the storm will intensify even more as it tracks towards the northwest. This storm will certainly produce a catastrophic storm surge along the Indian coast.

Check back to this blog in the next few days. I am currently looking at wind and tropical cyclone size forecasts issued by the Joint Typhoon Warning Center and comparing these values with historic storms in other ocean basins to provide some type of context and maybe even a rough estimate of potential surge heights. The work we are doing through SCIPP involves building a storm surge climatology, which can be used to provide context, and in some cases a range of possible surge estimates as storms develop.


Friday, October 4, 2013

A New, Simplified, Observed Storm Surge Map


NOAA Tides and Currents has provided near real-time water levels for numerous tide gages along the U.S. Gulf Coast. In this map, I've plotted the water heights for various stations at 2:00PM this afternoon.

Shell Beach, Louisiana, is reporting the highest storm surge level, with a height of 1.51 feet. Various locations in Louisiana, Mississippi and Alabama are reporting surge levels of 1-1.5 feet. Storm surge levels on the Texas and Florida coasts are less than 1 foot.

This latest map is a simplified version of the map I posted this morning. This new map simply plots the height of storm surge, which is the water level above normal tide levels, at a given location. The previous map also plotted storm tide levels, which are a combination of tide levels and storm surge. Historic water level heights are often recorded as storm tide, but the new map can be simplified and plotted completely as storm surge, because NOAA Tides and Currents provides both values.

These maps are experimental products. I'd appreciate your feedback in both encouragement and constructive criticism. What do you like about the map? What could be improved?

I'd like to note that we do not yet have an automated script to pull these values from NOAA Tides and Currents. These maps were created manually- and I'd like to give a shout out to undergrad student Bryant Garcin for helping build the data today. These maps will not likely be updated over the weekend, but, depending on the feedback we receive, we could generate these maps more regularly for the 2014 Hurricane Season.


Highest Surge Levels Observed along the Louisiana Coast This Morning


Storm surge levels were highest along the Louisiana Coast this morning, where water levels were at least 1.5 feet above normal in multiple locations. Water levels in East Texas, some portions of Louisiana and coastal Mississippi were generally 1-1.5 feet above normal. East of the Mississippi/ Alabama border, water levels were generally less than 1 foot above normal.

This map is an experimental product, which shows observed water levels as well as the track of the storm that produced them. I'd love feedback on this product! What do you like? What could be improved? Please send any ideas to: hal@srcc.lsu.edu.

Thanks!
Hurricane Hal

Karen's Surge May Be a 5 or 6 Year Coastal Flood Event for Portions of SE Louisiana and Mississippi

The National Hurricane Center is predicting that the highest storm surge levels from Tropical Storm Karen may occur from the Mouth of the Mississippi River east to Mobile Bay. The 7AM CDT advisory this morning says that water levels could reach 3 to 5 feet above ground level in this area if the peak surge occurs at high tide. Considering the tidal range and land elevations above sea level in this region, this prediction converts over to approximately a 6 to 8 foot storm surge.

The National Hurricane Center's Storm Surge Exceedance Product predicts the highest storm tide levels could occur off the coast of Southeast Louisiana and Mississippi.


Interestingly, this coastal region also took the brunt of Hurricane Isaac's surge last August, as well as the highest water levels in Hurricane Gustav (2008) and Katrina (2005). So how often does this region experience surge events, and, more specifically, how frequently would a 6-foot surge inundate this area?

SCIPP is developing a storm surge frequency tool that can answer these questions. The tool is still experimental and will not be launched until 2014. However, Tropical Storm Karen provides a great opportunity to give this web tool a test run.

SCIPP is developing a storm surge frequency web tool that will enable users to better understand the frequency of storm surge inundations in a specific area. This image provides customized surge data for a region within 25 miles of Gulfport, Mississippi.


In the image above, I clicked on Gulfport, Mississippi and chose a circle radius of 25 miles. The tool instantly gave me a list of all the historical storm surge inundations that have occurred in this region since 1900. In this region, SURGEDAT has historic water levels from 37 unique tropical cyclones (hurricanes and tropical storms).

Check out the graphs in the upper right corner of the screen. The bar graphs tell me that a 100-year storm surge in this region is a surge height of 24.75 feet. Meanwhile, the logarithmic scale below the bar graph provides return periods for specific water levels. As the latest NHC advisory mentions the possibility of a 6-8 foot surge in this region (3-5 feet above ground level if at high tide), I select 6 feet on this scale. The tool tells me that this water level is reached or exceeded in a tropical surge event every 6 years on average in this area, which would make Karen a 6-year event if this water level is reached.

This image provides surge history for an area within 25 miles of Shell Beach, Louisiana. SURGEDAT provides historical surge data for 48 unique tropical cyclones (hurricanes and tropical storms) that have generated high-water marks in this region.


I also used this tool to generate storm surge statistics for an area within 25 miles of Shell Beach, Louisiana. SURGEDAT has identified high water marks for 48 unique tropical cyclones (hurricanes and tropical storms) within this area. All of these high water marks occurred in Louisiana. The tool tells me that the 100-year storm surge in this area is 19.15 feet and a level of 6 feet should be reached or exceeded approximately every 5 years. The tool also tells me that a 6-foot storm surge within 25 miles of the mouth of the Mississippi River would occur every 9 years on average.

If you paid close attention to these numbers, you've realized that the Mississippi Coast has a higher 100-year storm surge level than SE Louisiana, while SE Louisiana has a higher 5-year storm surge return period. This water level was reached at least 18 times along coastal Mississippi since 1900, and 24 times in Southeast Louisiana (within 25 miles of Shell Beach).

Although data quality may slightly affect these numbers, these values are likely accurate. The profile of the Mississippi Coast drives some of the world's largest storm surges into this area. While SE Louisiana also has observed many high storm surges throughout history, this region also captures many small-magnitude surge events, as the coastal profile sticks out into the Gulf of Mexico and tends to capture high water from tropical cyclones that are positioned almost anywhere in the Gulf of Mexico.

By contrast, other portions of the Gulf Coast, like the West Coast of Florida, are generally less vulnerable to storm surge. SCIPP's Storm Surge Frequency tool told me that a 6-foot storm surge in the Tampa Bay area only occurs about every 20 years, based on historical data going back to 1900. Such analysis reveals that storm surge inundations have considerable geographic variation, making areas like coastal Mississippi and Southeast Louisiana more vulnerable to surge inundations than other locations along the Gulf Coast.

Thursday, October 3, 2013

Surge Maps from Tropical Storms along the Northern U.S. Gulf Coast


Wind shear and some dry air entrainment have been making it difficult for TS Karen to get better organized today. Satellite imagery this afternoon is less impressive than this morning.


Nonetheless, the National Hurricane Center's 1PM CDT advisory still places the maximum sustained winds of TS Karen at 65 MPH and forecasts that the storm may reach hurricane intensity while tracking towards the central U.S. Gulf Coast.

I've reached  into the storm surge archive today to find some storm surge/ storm tide maps from tropical storms that have generally tracked north and made landfall along the central U.S. Gulf Coast. Actually, the events I've pulled all occurred within the past 20 years. I've run a computer script today that plots the storm track and coastal flooding observations for the following storms:
Tropical Storm Alberto (1994)
Hurricane Isidore (2002)
Tropical Storm Bill (2003)
Tropical Storm Arlene (2005)

These maps make use of the SURGEDAT database, which has identified the location and height of more than 7,600 storm surge/ storm tide observations since 1880. The database pulls data from more than 70 sources, including government documents, books and academic publications, as well as historic newspapers.

The maps are pasted below. But before we get to the maps, I wanted to provide a bit of clarification because this is the first time I've posted maps this season.

1. These maps are in no way a forecast or an indication of surge potential related to TS Karen. If you're interested in surge forecasts, please see the National Hurricane Center website. This resource provides surge forecasts in the latest advisory, as well as some great storm surge probability and surge exceedance products.

2. The purpose of these maps is to provide historical context. In some cases, we've seen geographic patterns in the high water history, which may indicate where high water tends to pile up in a given region. That was the case last year with Hurricane Sandy. Many people were surprised to find some of the highest water levels in the New York Metro area occurring in SW Long Island Sound, but this was a very similar pattern to the 1938 Long Island Express Hurricane. Along the central Gulf Coast, some favorite locations where water likes to pile up include SE Louisiana, east of the Mississippi River, and also along the Mississippi Coast.

MAPS:


INSIGHTS:
All four of these storms crossed the Gulf of Mexico from south to north as tropical storms. Isidore reached hurricane status when the center of circulation was near Cuba and the Yucatan Peninsula, but then moved across the Gulf of Mexico as a tropical storm.

The highest water level in three of these four storms was 4-8 feet above various datums, or vertical reference lines. (Note: These water levels do not refer to height above ground level, like some of the latest NHC products.) Hurricane Isidore was the exception, which produced storm surge heights exceeding 8 feet along portions of the Mississippi and Louisiana coasts. The highest storm surge level produced by Isidore was 8.3 feet at the Rigolets in extreme E Louisiana (near the Mississippi border), while a storm surge of 8.26 feet was recorded at Gulfport, Mississippi.

Although all of these events were tropical storms, it should be noted that Isidore was a fairly intense tropical storm with a relatively large wind field. At about 8 hours before landfall in SE Louisiana, Isidore produced max wind speeds of 55 knots (~ 63MPH), with a radius of tropical storm force winds extended 300 nm (345 miles) from the center of circulation (Demuth et al. 2006).

By comparison, at the latest advisory, TS Karen's tropical storm force wind field only extended about 105 miles from the center of circulation. Generally speaking, tropical cyclones with larger wind fields tend to produce more coastal flooding, so it's important to consider the size of such storms and not just the maximum sustained wind speed.

Stay tuned to this blog for more historical storm surge information and/or updates on observed water levels along the U.S. Gulf Coast. There is also a slight chance I may be able to get field observations/ photos from the impacted surge area Fri or Sat. If you want to contact me, the best way is through email at: hal@srcc.lsu.edu.

Thanks!
-Hurricane Hal
TS Karen Forms in the SE Gulf of Mexico

Tropical Storm Karen formed this morning in the SE Gulf of Mexico. The National Hurricane Center provides excellent satellite images and animated loops, which are updated regularly. The image above is an infrared image, which essentially shows temperatures across the Gulf of Mexico region. Colder temperatures indicate higher cloud tops and more enhanced convection. This image shows some impressive outflow (see the white cirrus clouds on perimeter of cloud deck), which may be one reason why Karen is strengthening so rapidly.

The National Hurricane Center forecasts Karen to track into the central Gulf of Mexico, then eventually make a turn to the north and northeast. The center of circulation should approach the northern Gulf Coast over the weekend.


Catching Up with News from the Past Year


Hurricane Hal's Storm Surge blog will be updated frequently in the next few days to provide perspective on coastal flooding associated with Tropical Storm Karen, which formed in the Gulf of Mexico this morning.

But before we get to Karen....I just wanted to touch base with fans of this blog to catch up on some of the highlights of the past year. Unfortunately, I've had little time for blogging, as work has been so busy. But I did want to send a warm thank you to all of the  fans that read this page and provided encouragement. I received correspondence from readers as far away as New Zealand!

A few highlights from the past year...

1. SCIPP Projects: SCIPP has been continuing to generate cutting-edge climate research on topics as varied as drought in the plains to coastal flooding and sea-level rise along the Gulf Coast. We've been developing new web tools that provide information on topics such as reservoir levels and historic storm surge inundations.


SCIPP continues to generate cutting-edge research on topic as varied as drought in the plains and coastal flooding/ sea-level rise along the Gulf Coast.


2. Publications:

EOS Transactions featured a front-page article on SURGEDAT this past June. The article basically provides a snapshot of our global database. Several additional articles are nearing the end of the review process. These articles have analyzed how tropical cyclones generate storm surge. In summary, we've found that storm surge levels correlate better with pre-landfall wind speeds, particularly 18 hours before landfall, than they do with tropical cyclone winds at landfall. We also found pre-landfall tropical cyclone size correlates about as well as pre-landfall winds for generating surge. I will post more info about these publications, once they go to press.

                                               Snapshot of the EOS Transactions Article

3. New Website Look and Functionality:
The SURGEDAT website now has a new look and new functionality. A global surge map enables users to map surge events of given magnitudes. Also, we now have an interactive surge tool that enables users to map out surge/ storm tide observations from past surge events along the U.S. Gulf Coast. We've also added surge/ storm tide maps of the top 10 highest surge events along the U.S. Gulf and Atlantic Coasts. Check out the SURGEDAT website at: surge.srcc.lsu.edu.

The SURGEDAT website now has a new look, and new features as well.


The SURGEDAT website now has storm surge/ storm tide maps for the top 10 highest magnitude surge events along the U.S. Gulf and Atlantic Coasts. This is a map of the surge/ storm tide produced by Hurricane Katrina in 2005, which was the highest-magnitude surge event in modern U.S. history.


4. Where do we go from here?
I will be updating the blog frequently in the next few days as TS Karen approaches the Gulf Coast. Look for updates to provide historical context to Karen's observed and forecast surge.

After the storm passes, I'm planning to update this blog more frequently with information about historical surge observations, research and planning/ preparedness for coastal flood events.