Monday, October 26, 2015

Patricia's Surge Impacts Include Structural Damage, Coastal Erosion and a Ship Run Aground

Hurricane Patricia slammed Mexico's Pacific coast with category-5 winds late Friday. Although extreme winds caused most of the damage, reports are now surfacing about the extent of damage caused by storm surge.

Patricia's most destructive surge impacted a relatively small area, particularly around Barra de Navidad, a small community east of the hurricane's eye.

Patricia's most severe coastal impacts were felt in communities on bays to the east of landfall, such as Barra de Navidad.
Map created by Hal Needham.


One of the biggest coastal impacts was structural damage where storm surge and high waves crashed into buildings. A Weather Channel article provides direct quotes of surge flooding in coastal hotels:
-->(http://www.weather.com/news/weather/news/hurricane-patricia-mexico-pacific-coast-impacts).

Direct quotes:

-->
"Residents of the coast where Patricia came ashore described an enraged sea that crashed into hotels, scooping beach away from their foundations, and howling winds that toppled trees and telephone posts."

"'The waves were coming into the hotel,' said Domingo Hernandez, a watchman at the Hotel Barra de Navidad in the resort village of the same name in Jalisco state."


Storm surge and high waves crash into a structure along Mexico's Pacific Coast on Friday, October 23. Image: @atc26


Patricia's surge and high waves caused considerable damage in the Mexican state of Colima, east of Patricia's path.
Image: @Foro_TV on Twitter.


Coastal erosion was another impact of Patricia's storm surge. According to @Foro_TV, storm surge and waves eroded 30-50 m (98-164 ft) of coastline near Barra de Navidad. See Twitter screen shot below.

 Patricia's strong winds and surge caused a cargo vessel to run around near Barra de Navidad. According to 9 News Australia, helicopter rescue was needed rescue 27 crew members.

 Patricia's strong winds and storm surge drove a cargo vessel aground near Barra de Navidad.


Some thoughts on Patricia's storm surge:

1. Although Patricia's storm surge was destructive for several coastal communities, the area impacted by the worst storm surge was relatively small. Several factors led to this pattern.

As the most vulnerable coastline faced southwest, prolonged east winds as Patricia approached were blowing offshore. The wrap-around winds on the backside blew surge and waves into coastal communities, but only those near the eastern eyewall. This can be contrasted to areas along the Texas and Louisiana coast in the U.S. that "catch" surge blown from east winds, which can pile up for more than 48 hours as a hurricane approaches. Also, the area of Patricia's hurricane force winds was relatively small, which led to a less extensive storm surge.

2. Storm surge is often very localized.  Communities several miles apart sometimes experience very different conditions. Factors such as coastline shape and storm track often have strong influence on water levels. This is most pronounced near bays, inlets, delta systems or areas where levees, dikes or other flood control structures block the flow of water. Broad, "open" coastlines with less of these physical features tend to observe more consistent water levels. In Patricia's case, we should not be surprised that areas east of Manzanillo and the region near Puerto Vallarta did not experience high storm surges, while communities like Barra de Navidad experienced surge and waves crashing into hotels.

3. Fortunately, Patricia's track did not directly strike highly populated areas. This minimized surge and wave impacts. However, when storm surge strikes rural areas it often takes several days for pictures and videos to surface. Even then, we often need field teams to go into the impact zone and measure high water marks. It can take months for accurate scientific measurements to be compiled into a report that provides "official" documentation.

This is my last post on Hurricane Patricia. My thoughts and prayers are with people who live in the impacted area....let's hope for a strong recovery. 
-->

Sunday, October 25, 2015

Heavy Rain/ High Tides Produce Flooding in Houston/ Galveston Area

Heavy rain and high tides have produced flooding in the Houston/ Galveston area overnight. I will be out documenting the flooding today. For current pics and videos, go to my Twitter page. Handle: @Hal_Needham.

Yesterday, prolonged onshore winds drove waves into the Galveston Seawall. The pic below is from near the western end of the Seawall. Although storm surge levels should remain under 3 ft in this event, the combination of storm surge and heavy rains will inundate low-lying roads, particularly near the coast.

I will do a final post on Monday morning about the flooding in Texas and Louisiana.

Onshore winds drove waves into the Galveston Seawall on Saturday afternoon. I took this picture from near the western end of the Seawall.

Saturday, October 24, 2015

Patricia's Remnants will Exacerbate Flood Threat in Texas and Louisiana

-->
A complex flood event threatens Texas and Louisiana over the next several days. A combination of a slow-moving front, the availability of ample moisture, and prolonged onshore winds will put Southeast Texas and South Louisiana on alert through the weekend.

Low pressure is forming along a slow-moving front in Texas, which is serving to pump tremendous amounts of moisture from the Gulf of Mexico. The remnants of Hurricane Patricia, which struck Western Mexico yesterday as a category-5 hurricane, will add even more moisture to this developing flood event in Texas and Louisiana.

 National Weather Service radar depicts ample moisture streaming into Texas from the south and southwest as of Saturday morning. Moisture will pump into coastal Texas for at least two more days.
Image: http://radar.weather.gov/Conus/southplains_loop.php.


Patricia became the most intense reliably-measured hurricane in history, as it produced maximum sustained winds of 200 mph (322 kph), before weakening as it neared the coast (Masters 2015). The storm generated severe wind and flood damage, particularly west of Manzanillo. 

 Hurricane Patricia flooded the city of Manzanillo with heavy rain and storm surge on Friday, October 23.
Image courtesy Erick L via @sandhyaABC7 on Twitter.

Although Patricia’s winds will not directly impact Texas, its moisture will help create phenomenal rains, particularly near the U.S. Gulf Coast. NOAA’s Quantitative Precipitation Forecast map depicts a widespread area of rain will exceed 6 inches, particularly along and to the south of the I-10 corridor in Texas and Southwest Louisiana over the next two days. This forecast predicts a maximum value > 11" along the Houston- Galveston corridor.

The Houston-Galveston National Weather Service Forecast Office (NWS Houston) predicts that rainfall rates could exceed 3"/ hour along coastal Texas Saturday night and Sunday.

 NOAA's Quantitative Precipitation Forecast predicts a widespread area will receive more than 6" of rain along coastal Texas and Louisiana, with maximum amounts exceeding 11" near Houston- Galveston.
Image: http://www.wpc.ncep.noaa.gov/qpf/day1-2.shtml.
An extended storm surge event, which will produce water levels noticeably above normal high tide levels, will exacerbate flooding near the coast and even inland. Water levels at Galveston’s Pier 21 have been running more than 1 foot (0.3 m) above normal over the past several days.

High water levels and surf were noticeable already on Friday morning, as waves reached the seawall. I took the photo below on the Galveston Seawall yesterday morning. Several locals at the Living on the Edge Conference told me that water gets that high about one time per year.

 Onshore winds drove sea water to the base of the Galveston Seawall on Friday morning. Locals said this happens about one time per year. Photo: Hal Needham


NWS Houston predicts that water levels could reach as high as 4.8 feet (1.46 m) above a datum called Mean Lower Low Water (MLLW), particularly on Sunday. This level would be approach 3 feet above predicted tide levels (if we take away the storm). The highest water over the past several days was approximately 3 feet (0.91 m) above MLLW at Galveston Pier 21, or about 1.3-1.5 feet (0.4-0.46 m) above normal.

Although a 3-foot (0.91m) storm surge is not phenomenal for Galveston, a prolonged 2-3 foot (0.6-0.91 m) surge could have dire impacts if accompanied by 10 or more inches of rain. Most drainage around the Houston- Galveston area is gravity-fed, meaning the drainage depends on a noticeable slope between the ground and the water body into which the rainwater is discharged, like a bayou, channel, Galveston Bay or the Gulf of Mexico.

 Water levels at Galveston's Pier 21 have been running around 1.3-1.5 ft (0.4-0.46m) above normal over the past few days. This has produced maximum storm tides of around 3 ft (0.91m) above MLLW. The National Weather Service predicts tide levels could reach 4.8 ft (1.46m) above MLLW this weekend, which would be as much as 3 ft (0.91m) above normal.

If Galveston Bay is elevated 2-3 ft (0.6-0.91m) above normal, the slope between land and water is reduced considerably, making rainfall drainage less efficient. This becomes a major concern when looking at the extraordinary rainfall in the forecast.

The combined flood risk from heavy rainfall and heightened seas has been a focus of new research in the past several years, and certainly relates to climate change, as melting glaciers and thermal expansion push sea levels upward. Dr. Thomas Wahl and colleagues recently published a paper (Wahl et al. 2015) proving that combined flooding from heavy rainfall and heightened sea levels was becoming more common along the U.S. Gulf and Atlantic Coasts.

I will be in the Houston- Galveston area through this weekend, as I attempt to document this complex flood event. Feel free to shoot me an email or contact me on Twitter with any questions or comments. Also, always feel free to send in pics or videos from coastal flood events around the world.

REFERENCES
Masters, J., 2015: Category-5 Hurricane Patricia Hitting Mexico's Pacific Coast. Blog post from Friday, October 23, 2015. Link: http://www.wunderground.com/blog/JeffMasters/comment.html?entrynum=3166.

Wahl, T., S. Jain, J. Bender, S.D. Meyers, and M.E. Luther, 2015: Increasing risk of compound flooding from storm surge and rainfall for major US cities. Nature Climate Change, doi: 10.1038/nclimate2736.

Friday, October 23, 2015

"Cat 7" Hurricane Patricia Threatens Western Mexico

"Category 7" Hurricane Patricia Threatens Western Mexico. The hurricane is generating astonishing sustained winds of 200 MPH (325 KPH), according to the latest (1500UTC/ 1000CDT) advisory from the U.S. National Hurricane Center.

The Saffir-Simpson Hurricane Wind scale rates hurricanes on a scale of 1-5, depending on the maximum sustained winds. The strongest hurricanes, categorized as category 5 storms, produce maximum sustained winds exceeding 155 mph, and inflict catastrophic wind damage. However, one limitation to this bounded scale is that hurricanes with winds of 160 mph and 200 mph are both classified as category 5 storms.

 Infrared satellite imagery from the CIMSS Tropical Cyclone Group at the University of Wisconsin depicts category-5 Hurricane Patricia approaching Western Mexico on Friday, October 23, 2015.

If the Saffir-Simpson Hurricane Wind scale were a continuous scale, with no upper bound, Patricia might be classified as a category-7 hurricane. Considering that category-3 hurricanes produce winds of 115-135 mph, and cat 4 hurricanes produce winds of 135-155 mph, if we continued using 20 mph wind categories, cat 5 hurricanes would be categorized 155-175 mph, cat 6 hurricanes 175-195 mph, and rare cyclones like Patricia and Super Typhoon Haiyan, which impacted the Philippines in 2013, could be classified as cat-7 tropical cyclones, with winds exceeding 195 mph.

I'm not too serious about re-writing the hurricane classification system (at least not today), but it is good to question the status quo and make sure we accurately depict the amazing intensity of the most severe hazards.

Visible satellite imagery from the CIMSS Tropical Cyclone Group at the University of Wisconsin depicts category-5 Hurricane Patricia approaching Western Mexico on Friday, October 23, 2015. This 1-km resolution image shows Patricia's tightly-wrapped eye, which is common in the most intense hurricanes.

Some may argue that once winds reach 155 mph, there is no difference in wind destruction. From a wind engineering perspective this may be true, however, other hurricane hazards, like storm surge, are generally related to pre-landfall maximum sustained winds (although other factors, like hurricane size, are also important.)

I co-authored a paper with Dr. Barry Keim in 2014 that found a significant relationship between storm surge heights and pre-landfall winds, with hurricane winds 18 hours before landfall producing the best relationship with surge levels. We also found a non-linear relationship between storm surge heights and pre-landfall winds. According to this study, we found that doubling pre-landfall hurricane winds increases surge potential by a factor of 4.59. This means that the strongest hurricanes move much more sea water than "average" hurricanes.


Storm surge heights relate better to pre-landfall winds than wind speeds at landfall. This graphic shows that wind speeds 18 hours before landfall correlate best with surge heights (see Needham and Keim (2014)). This is a concern as Hurricane Patricia approaches Mexico's West Coast with maximum sustained winds of 200 mph (325 kph).

These principles should concern us when we consider Patricia's pre-landfall winds of 200 mph (325 kph). From a storm surge perspective, the only approximate analog to Patricia in the literature is Hurricane Kenna, which produced pre-landfall winds of approximately 165-170 mph (270 kph), and generated a 16.5 (5 m) storm surge at San Blas, Mexico (Franklin 2002). Kenna also generated 10 ft (3.05 m) waves at Puerto Vallarta (Franklin 2002).

Needham et al. (2015) provides an overview of storm surge data sources, observations and impacts for Western Mexico. Kenna's storm surge is the highest observed coastal flood event for this region, according to the SURGEDAT global storm surge database (see  http://surge.srcc.lsu.edu/).

Patricia is substantially stronger than Kenna and will make landfall farther south. The area to the west of Manzanillo will likely be most vulnerable to storm surge. Coastal interests in this region should brace for an exceptional wind event, with catastrophic storm surge flooding. I expect that Patricia's surge heights will likely exceed 16.5 ft (5 m), and will be accompanied by large, destructive waves. This would be the largest storm surge in the modern history of Western Mexico.

 Storm surge heights to the west of Manzanillo may exceed 16.5 ft (5 m), as Hurricane Patricia approaches Mexico's west Coast. This photo shows a sunset over Manzanillo.
Image: Wikipedia Commons

Moisture from Patricia will stream into the southern U.S. and exacerbate the heavy rainfall event that has already started in Texas. I am in Galveston, Texas, today, where the coastal population is bracing for substantial flooding from the combination of high "tides" (surge) and heavy rainfall over the next several days. I will write another post soon about the flood potential in Texas, including some on-the-ground pics I took this morning.

REFERENCES

Franklin, J.L., 2002: Tropical Cyclone Report, Hurricane Kenna, 22-26 October, 2002, National Hurricane Center, Miami, Florida.

-->
-->
Needham, H.F., B.D. Keim, and D. Sathiaraj, 2015: A Review of Tropical Cyclone-Generated Storm Surges: Global Data Sources, Observations and Impacts. Reviews of Geophysics, Ahead-of-Print version posted online June 30, 2015 and available at: http://onlinelibrary.wiley.com/doi/10.1002/2014RG000477/full.

Needham, H.F., and B.D. Keim, 2014: Correlating Storm Surge Heights with Tropical Cyclone Winds at and before Landfall. Earth Interactions, 18, 8, 1-26.

Sunday, October 4, 2015

Live Coverage of Storm Surge Flooding in New Jersey

I flew to NJ yesterday evening and I just arrived at the coast. I will document the coastal flooding live today.

I just went on beach at Cape May. Seas were angry and I got sandblasted by sustained winds of at least 35 mph.

Locals told me flooding is worse near Ocean City. Driving coastal road now.

Cannot uploads pics from my phone to blog. Go to my Twiiter for pics, vid and possible Periscope stream!

My Twitter handle is @Hal_Needham.

-Hurricane Hal

Friday, October 2, 2015

Surge Levels Now Exceed 3 ft at Five Locations between Delaware and Chesapeake Bay

Storm surge levels continued to rise this evening as a persistent onshore wind continues to blow from the northeast from North Carolina through New England.

Surge levels are now > 3 ft for at least five locations between Delaware and Chesapeake Bay. The total water level, or storm tide (surge + tide) should continue to rise in most locations as high tide approaches most coastal areas around 1:00AM Eastern Time Saturday. High tide will occur a little later on bays and inlets.

Low tides should be observed around daybreak Saturday, with high tides occurring again around 1:30PM Eastern Time at the coast.

Storm surge observations as of 1000 PM Eastern Time on Fri Oct 2. These data are provided by NOAA Tides and Currents.

A 3-ft storm surge has a greater impact than one might expect because of the following:

1. The tidal range across much of this region is 4-5 feet between low tide and high tide. Adding 3 ft to the high tide level will cause coastal inundation in many low-lying areas.

2. Elevated coastal water levels slow the drainage of heavy rainfall, because most drainage systems are gravity fed. A prolonged storm surge can cause fresh water flooding from 1-2 inches of rain, when typically that much rain runs off quickly.

3. The prolonged nature of this wind/ surge event means storm surge will be added to at least eight high tide cyclones. Such persistent conditions will likely cause much more coastal erosion than usually experienced from a 3-4 ft surge.

Prolonged Surge Event Underway along Eastern Seaboard

A prolonged storm surge event is underway along the Eastern Seaboard. A strong pressure gradient  between a dome of high pressure over Canada and Hurricane Joaquin near the Bahamas is producing a sustained northeast wind from North Carolina to New England.

 Streets flooded in Ocean City, NJ on Fri Oct 2 as high water from both storm surge and steady rain inundated the area.
Photo: http://6abc.com/weather/photos-flooding-in-ocean-city-nj/1013456/

As of 0800AM EDT today, storm surge levels exceeded 2 ft above predicted tide levels from North Carolina through Southern New Jersey. Several sites near the mouth of the Delaware Bay and Chesapeake Bay reported storm surge levels between 2-3 ft. The highest storm surge level observed by NOAA's National Ocean Service (NOS) tide gauges was 3.05 ft, at Wachapreague, Virginia.

Storm surge levels at 0800AM EDT exceeded 3 ft in Eastern Virginia, with many sites between North Carolina and New Jersey observing surge levels between 2-3 ft. Data: NOAA Tides and Currents; Image: Hal Needham

As this wind and surge event will last for at least four days, storm surges will be added to at least eight high tide cycles. The most noticeable flooding will occur near the time of high tide.

High tide will occur just after noon today for much of the Mid-Atlantic Coast. In most places, high tide occurs approximately every 12.5 hours, so it will occur again Saturday morning after midnight, and again early afternoon on Saturday. High tide in bays and coastal inlets often occurs around an hour after peaking at the coast.

At Wachapreague, Virginia, high tides should occur around 12:30PM Friday, 1:00AM Saturday, and again around 1:30PM Saturday afternoon. The difference between low and high tide at this site exceeds 4 ft.


 Tide gauge graph from Wachapreague, Virginia, depicting observed and predicted water levels. Base Graphic: NOAA Tides and Currents. Edits: Hal Needham

The regional surge map shown at the top of this blog post depicts surge levels at precisely 0800AM EDT. Keep in mind that even if those surge levels do not increase, as high tide approaches, coastal inundation should be more noticeable. Stay tuned to your updates from your local National Weather Service office, and the National Hurricane Center for more updates on this developing event.


Thursday, October 1, 2015

Wind, Rain and Surge Will Not Miss the East Coast, Regardless of Joaquin's Track

The National Hurricane Center's 5PM EDT update forecasts Hurricane Joaquin to track farther east than previous forecasts. These changes reflect eastward shifts in various models, such as HWRF, GFS and UKMET, to reflect solutions closer to the ECMWF (European) model, which all along has been predicting Joaquin to take an eastward turn.

The 5PM EDT update from the NHC shifted Joaquin's track to the east. Source: www.nhc.noaa.gov.
While this updated forecast provides a collective relief for many along the Eastern Seaboard, it's not time to celebrate yet. Hurricane Joaquin is just one player in a complex drama that is taking place along the U.S. East Coast, and, in a sense, other characters in this play will not allow Joaquin to "miss" the East Coast.

A large, strong area of high pressure is building over Eastern Canada, and the gradient between Joaquin and this dome of high pressure will generate strong onshore winds for more than four consecutive days from North Carolina through New England. This situation will play out regardless of Joaquin's exact track. Persistent northeast winds will cause prolonged storm surge flooding and coastal erosion, particularly from Virginia through the New York City area.

The maps below show GFS model output. These maps were initialized (run) at 1200UTC (8AM EDT) on Thu Oct 1, and predict conditions for 1200UTC (8AM EDT) on Sat Oct 3 and Sun Oct 4. Note the tightly packed isobars in boxes 1 and 2, which are predicted to occur 24 hours apart.

 The GFS Mean Sea Level Pressure forecast for 1200 UTC (8AM EDT) on Sat Oct 3 depicts Joaquin near the Northern Bahamas and a very tight pressure gradient from North Carolina to New England. Source: http://moe.met.fsu.edu/tcgengifs/, edited by Hal Needham.
  The GFS Mean Sea Level Pressure forecast for 1200 UTC (8AM EDT) on Sun Oct 4 moves Joaquin to the NNE, but keeps the tight pressure gradient along the U.S. East Coast. Source: http://moe.met.fsu.edu/tcgengifs/, edited by Hal Needham.


The two maps below depict ECMWF model forecasts for the same times (1200 UTC/ 0800 EDT on Sat Oct 3 and Sun Oct 4). This model also predicts Joaquin will be centered near the Bahamas on Saturday, but predicts the storm to track NE, away from the U.S. mainland on Sunday.

However, notice how the isobars, or lines of equal pressure, stay packed in the boxes on both of these maps as well. When we step back and look at the scale of this widespread wind event, we begin to understand why Joaquin won't fully "miss" the U.S. East Coast, even if it tracks out to sea.

The ECMWF forecast for 1200UTC (8AM EDT) Oct 3 forecasts Joaquin near the Bahamas and a tight pressure gradient along the U.S. East Coast, from North Carolina to New England. Source: http://moe.met.fsu.edu/tcgengifs/, edited by Hal Needham.

Although the ECMWF model forecast for 1200UTC (8AM EDT) Sun Oct 4 predicts Joaquin to track east of the Bahamas, and away from the U.S. mainland, note the strong pressure gradient that remains in the box. Source: http://moe.met.fsu.edu/tcgengifs/, edited by Hal Needham.


Unfortunately, these strong winds will persist four or five days, which spells trouble because the East Coast will need to endure at least 10 high tide cycles during this surge event. Although surge levels may not reach as high as Hurricane Isabel (2003) or Sandy (2012) in this region, this prolonged surge will generate substantial flooding and excessive coastal erosion.

In addition to prolonged coastal winds and storm surge, a stalled out cold front will produce torrential rains in the Carolinas and Virginia, with portions of South Carolina forecast to receive > 15 inches of rain through late Sunday.

Low pressure tracking along a stationary front off the Southeast Coast will generate torrential rains that may exceed 15 inches in South Carolina through Sunday. Image: http://www.wpc.ncep.noaa.gov.

The combination of prolonged onshore winds, storm surge, beach erosion and torrential rains will produce substantial weather impacts along much of the Eastern Seaboard, regardless of Joaquin's exact track.


Extraordinary Onshore Wind and Surge Event to Impact Eastern Seaboard as Hurricane Joaquin Approaches

-->
An extraordinary onshore wind and surge event will develop along the Eastern Seaboard over the next several days. Although Hurricane Joaquin is grabbing the headlines, and may directly produce the greatest wind, rain and surge impacts, Joaquin is just one of three players taking part in a complex drama that will unfold over the next several days.

The first player is a cold front and associated low-pressure system that dumped 2-4 inches of rain across a wide area from Virginia through Maine from Tuesday through Wednesday. This heavy rainfall saturated soils and elevated rivers, which will compound impacts from approaching Joaquin. Saturated soils will cause more of Joaquin's rainfall to runoff and cause flooding, while increasing the risk of downed trees, as wet soil provides less support than dry soil.

During the 24 hours preceding 1200GMT (8:00AM EDT) on Wed Sep 30, between 2 and 4 inches of rain fell across a widespread area from Virginia through Maine. Image: http://water.weather.gov/precip/.


Player #2 is a large area of high pressure building over eastern Canada behind this cold front. The strong pressure gradient between this massive area of high pressure and Hurricane Joaquin, Player #3, will generate prolonged onshore winds from North Carolina through New York. These winds will begin to blow hard long before Joaquin's arrival.
 
 GOES Floater RBTOP-IR Satellite Image of Hurricane Joaquin accessed 4:46AM EDT on Thu Oct 1. The pressure gradient between Joaquin and strong high pressure over Canada will enhance wind and surge impacts. Image: www.ssd.noaa.gov.

The duration of this wind event is absolutely mind-boggling. Data from the National Weather Service point forecast for Atlantic City International Airport (ACY), New Jersey, suggest a strong onshore wind event will occur over coastal New Jersey for more than 100 consecutive hours (Yes, four days and then some)! Let me explain in more detail.

-->
I've defined a "prolonged onshore coastal wind event" as a scenario in which winds along the Mid-Atlantic (New Jersey in this case) coast blow from between the N and E (compass bearings 0 to 90 degrees), with maximum sustained winds 20 mph for at least 75% of the observed hours. I chose these compass directions because Ekman Transport tends to deflect water to the right of the wind direction in the northern hemisphere, making a NE wind very efficient at piling up water along the East Coast.

 A strong onshore wind event is forecast to impact the Mid-Atlantic Coast along the Jersey Shore for more than four consecutive days (112 hours), generating a prolonged storm surge. Image of Atlantic City: taketours.com

Using this metric, coastal New Jersey will observe a strong onshore wind event lasting 112 hours, based on point forecast data for ACY. This forecast predicts that winds will exceed 20 mph by 12PM EDT on Thu Oct 1 and remain above this threshold for 88 out of 90 hours, until 5AM EDT on Mon Oct 5. Mind you that this extraordinary wind event occurs before Joaquin even makes its closest approach!

 The National Weather Service Point Forecast for Atlantic City International Airport, New Jersey, predicts northeast winds will reach 25 mph, with gusts to 40 mph during the day on Friday. An extended view of this graph reveals a strong onshore wind event will last ~ 90 hours before Joaquin even arrives. Image: forecast.weather.gov; edited by Hal Needham.


Winds are then forecast to drop slightly below the 20 mph threshold, before quickly increasing with the closest approach of Joaquin. Adding the winds from Joaquin's closest approach increases our coastal wind event to 112 hours, with onshore winds 20 mph forecast at 102 of those 112 hours (91.1% of observations).

Of course, much uncertainty remains regarding Joaquin's track, timing and intensity.  But the big picture here is that a prolonged coastal wind event will occur even before Joaquin arrives, making coastal flooding and erosion impacts more likely.

  The strongest winds along the Mid-Atlantic coast should arrive late Mon into early Tue, according to this National Weather Service point wind forecast for Atlantic City. Note that Joaquin is forecast to impact this area AFTER a 90-hour strong onshore wind event.  Image: forecast.weather.gov; edited by Hal Needham.

This developing situation is truly historic and has not been observed in the modern history of the Mid-Atlantic Coast. I worked with Josh Gilliland, a PHD student at Louisiana State University, and the only Cleveland Brown's fan I know, to analyze the wind history for ACY. We were interested to find previous events that may have resembled the current forecast. Hourly wind data were from 1950-2015 were provided by the National Climate Data Center's Integrated Surface Database (NCDC-ISD), available at http://www.ncdc.noaa.gov/oa/climate/isd/. Gilliland adjusted these obs to 10 m height, in accordance with wind data standards.

We found only six previous "prolonged wind events" that lasted ≥ 48 hours at ACY. None of these events were produced from onshore wind events, as they all were related to frontal passages, with strong winds blowing from the NW. All of these events occurred during winter or spring. I have listed the six events below:

 
-->
Rank
Year
Month
Date(s)
Duration (hours)
Obs ≥ 20 mph
% Obs 20 mph
Wind Direction
1
1975
Apr
4-7
94
76
80.9
Offshore (NW)
2
1962-1963
Dec-Jan
30-2
72
62
86.1
Offshore (NW)
3
1959
Jan
4-7
72
54
75
Offshore (NW)
4
1960
Feb
18-21
69
53
76.8
Offshore (NW)
5
1973
Mar
17-20
63
61
96.8
Offshore (NW)
6
1985
Feb
7-9
53
48
90.6
Offshore (NW)
Prolonged wind events (≥ 48 hours) for Atlantic City, New Jersey, from 1950-2014. All of these events occurred in winter or spring and were related with frontal passages (offshore winds).


The longest duration onshore wind event we could find since 1950 was related with a winter storm, from January 9-11, 1956. Within a 42-hour period, onshore winds > 20 mph were observed on 39 hourly observations (92.9%). During a 6-hour period, sustained winds ranged from 28-29.9 mph, but never topped 30 mph.


Duration of prolonged wind events at Atlantic City, NJ, from 1950-2015. Data provided by National Climate Data Center's Integrated Surface Database (NCDC-ISD).

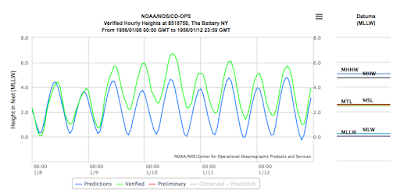
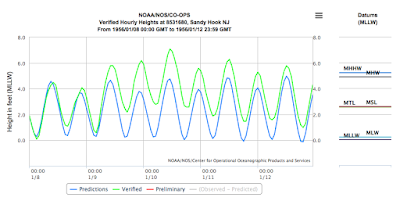
Tide gauges at Sandy Hook, NJ, and The Battery, NY (south end of Manhattan), depict this surge event from 1956 (unfortunately, the ACY tide gauge was not operating from 1951-1959).
 
Storm surge levels at The Battery reached approximately 2 ft, with a storm tide above MLLW peaking at 6.71 ft. See the graph below.


A storm surge of approximately 2 ft and a storm tide of 6.71 ft above MLLW were recorded at The Battery, NY, during a prolonged onshore wind event in January, 1956. The event this week should last considerably longer
with local onshore winds likely blowing harder than in 1956. Data and Graph: NOAA Tides and Currents.
 
 
 The January, 1956, onshore wind event produced even higher storm surges/ storm tides along the New Jersey Coast. The graph below depicts a storm surge of approximately 2.5 ft and a storm tide of 7.09 ft above MLLW at Sandy Hook, New Jersey.


A storm surge of approximately 2.5 ft and a storm tide of 7.09 ft above MLLW were recorded at Sandy Hook, NJ, during a prolonged onshore wind event in January, 1956. The event this week should last considerably longer
with local onshore winds likely blowing harder than in 1956. Data and graph: NOAA Tides and Currents.


Our current forecast predicts onshore winds for a longer time period (nearly 3x as long as 1956), with generally stronger wind speeds and potentially the approach of a hurricane or strong tropical storm. All of these factors would lead us to believe that the upcoming surge will be higher and last longer than the event in 1956.

So what does all this mean?

First of all, we are moving into new territory.

For now, one of the take home points is that this widespread wind event will create a long-duration storm surge even if Hurricane Joaquin does not make a direct landfall on the U.S. Atlantic Coast.

Also, even if Jaoquin's storm surge levels do not come close to those produced by Hurricane Sandy (2012) along the Mid-Atlantic Coast, or Isabel (2003) along the NC/ VA coast and Chesapeake Bay, the combination of long-duration surge and heavy rainfall on previously saturated soils, may flood some areas that were not inundated from Isabel or Sandy.

We should also consider these factors:

1. This surge event will last for many high tide cycles. The impacted region observes two high tides per day, so a 5-day surge event may stick around for 10 high tides. This will increase the risk of flooding in many locations.

 The National Weather Service has already issued coastal flood warnings for New Jersey and Delaware. Water levels may reach between 7.5 and 8.5 ft MLLW between now and 6AM EDT on Fri Oct 2.

2. Joaquin may flood areas not flooded by Sandy or Isabel, even if those storms produced higher surges at the coast. I am particularly concerned about areas "slightly" inland, such as  5-15 miles from the coast. How can rainfall drain into bays and rivers when they are elevated for multiple days from storm surge?

3. Even though our analysis focused on coastal New Jersey, wind, rainfall and surge impacts will likely extend from the Carolinas to New England.

 Tide predictions (blue) and observed water levels (red) at Atlantic City, NJ. The long-duration onshore wind event produce high water through two high tide cycles per day. The National Weather Service predicts water levels could reach 7.5 ft above MLLW at this location by 6AM EDT on Fri Oct 2. Many more days of strong onshore winds will follow.
Image: NOAA Tides and Currents.

We're facing multiple-hazards here and the interactions between rain and surge are complex to say the least.

If you've made it this far I would like to extend a hearty congratulations for making it through one of my longest blog posts ever! Well done, my friend!

Stay tuned to the National Hurricane Center, your local National Weather Service Weather Forecast Office, and your local media for future developments related to this complex forecast. I will continue to update this blog daily through the passage of Hurricane Joaquin.


-->