Monday, June 6, 2016

The U-Surge Project Launches Website for Cedar Key, Florida, as Colin Approaches


The U-Surge Project launches a community storm surge website for Cedar Key, Florida, today, as Tropical Cyclone Colin approaches. The website contains the first comprehensive data archive of coastal flood events at Cedar Key, a small village 80 miles north of Tampa.

Cedar Key, Florida, is a historic community around 80 miles north of Tampa


U-Surge selected Cedar Key as a partner community thanks to extensive weather records in this historic location and its strategic location near Apalachee Bay. The physical features of this region, like shallow water and the concave shape of the bay, efficiently create large surges. Fortunately, this region infrequently observes hurricane landfalls, at least compared to locations farther west and south along Florida's Gulf Coast. 


The U-Surge Project launches website for Cedar Key, Florida as Tropical Storm Colin approaches.

The historic record for Cedar Key contains 30 tropical surges, the highest of which reached 8.5 feet in Hurricane Alma of 1966. When these observations are converted to a common datum, or reference line, Alma’s water level drops to 8.11 ft above the North American Vertical Datum (NAVD88) of 1988, but still retains first place.


The U-Surge Project has built the first comprehensive coastal flood record for Cedar Key, Florida, which includes 30 events since 1920. Hurricane Alma of 1966 generated the highest recorded storm tide, with water levels reaching 8.11 ft above the NAVD88 datum.


Tropical Storm Colin


Tropical Storm Colin is forecast to track northeast today before making landfall near Apalachee Bay this evening. Although Colin has strengthened slightly overnight, the storm is rather disorganized, as the most intense convection is offset from the center of circulation. This is good news for residents of coastal Florida, as disorganized storms lack the broad shield of powerful winds for generating large surges.

Colin’s timing, however, makes things a bit more interesting. The storm is arriving just one day after the new moon, in a time of the lunar cycle in which tidal ranges increase. Fortunately, Colin is forecast to make landfall this evening, several hours after high tide. Therefore, expect the worst flooding impacts to occur around the time of this afternoon’s high tide, which is around 3:00PM local time at Cedar Key.

Predicted (blue), preliminary (red) and verified (green) water levels for Cedar Key, Florida, from May 27 - June 16. The red box shows the time of Colin's impact, when tidal ranges are high.
Base graph: NOAA Tides and Currents.

Colin's flood impacts should be most severe around the time of high tide this afternoon. In Cedar Key, high tide occurs around 3PM local time, so expect the worst flooding from around 2-4PM.
Base graph: NOAA Tides and Currents

I’m predicting that storm surge levels at that time will be around 2.5 ft above normal astronomical tides, creating a total water level of around 4.72 ft above NAVD88. Due to the high astronomical tides at that time, Colin’s total water level would rank 9th in the list of historic storm tides from tropical systems. Sea level rise helps boost Colin into the top 10, as storm tides are measures of total water levels, and sea levels have risen around 8 inches over the last century near Cedar Key.

Storm tide levels should exceed 4.7 feet above the NAVD88 datum at Cedar Key this afternoon, placing Colin's storm tide 9th in the historical records.

A storm tide of 4.72 ft above NAVD88 would top the water level produced by Tropical Storm Debby in 2012 by several inches near Cedar Key. Debby splashed water over flood defenses, flooded roads, and inflicted some property damage, as seen in the video below, which is also posted on the U-Surge webpage for Cedar Key. The U-Surge project helps residents compare current and past events, as water levels are converted to the same datum.

Tropical Storm Debby's storm tide inflicted some property damage near Cedar Key in 2012. Colin's storm tide may surpass Debby's, partly because Colin is striking near the time of the new moon, when the tidal range is higher than normal.

In general, Colin’s biggest impact should be heavy rain, as the heaviest convection is displaced to the east of the center of circulation and is already impacting Florida. Heavy rainfall compounded with higher-than-normal storm tides will cause minor flooding in coastal communities from Tampa north to Apalachee Bay.


Sunday, June 5, 2016

Tropical Storm Colin to Generate Coastal Flooding along Florida’s West Coast Monday


Tropical Storm Colin formed off the coast of the Yucatan Peninsula this afternoon. The National Hurricane Center forecasts the storm to track northeast and make landfall between Apalachicola and Cedar Key on Monday evening.


National Hurricane Center tracking map for Tropical Storm Colin


Flooding from the combination of heavy rain and storm surge will likely be Colin’s greatest impact. The Quantitative Precipitation Forecast (QPF) from the National Weather Service’s Weather Prediction Center forecasts the potential of 4 or more inches of rain over the next two days along Florida’s West Coast.


The QPF Map forecasts 4"+ of rain near Florida's Gulf Coast between Sunday and Tuesday Evening.


The National Hurricane Center (NHC) forecasts water levels from coastal flooding to reach as high as 3 ft above ground level north of Tampa Bay, and 2 ft above ground level from Tampa Bay south to Florida Bay, if the maximum inundation occurs at high tide.

This prediction relates closely to storm surge observations from Tropical Storm Andrea (2013), a great analog storm for Colin. Andrea formed in the central Gulf of Mexico and tracked northeast, making landfall in Apalachee Bay, north of Cedar Key, about 24 hours after forming. Colin’s forecast track and forward speed are similar, although Colin is moving slightly faster.

The map below shows Andrea’s track and storm surge observations. Cedar Key observed the high-recorded storm surge, at 4.55 ft, followed by McKay Bay Entrance, in Tampa, which recorded a storm surge of 3.34 ft. These water levels were high enough to inundate land from Tampa to Apalachee Bay.


Tropical Storm Andrea's storm surge and track map from the U-Surge Project


Note that the map provides storm surge levels but the NHC forecasts inundation levels. Storm surge is the height above normal astronomical tide, but inundation level is the height above the ground. So if land would normally be 3 ft above tidal level, a 4.5 ft surge would cause a 1.5 ft inundation.

We must keep in mind that such maps are not a prediction of Colin's surge, but rather a historical comparison that provides context and gives us some idea about likely storm surge patterns. For example, note that Andrea's storm surge level inside Tampa Bay was actually higher than on the open coast. Storm surge often reaches localized maximum levels on the inside of bays, where the bay shape forces water into a relatively small area, making it rise.

A year before Andrea, Tropical Storm Debby (2012) approached Florida’s Gulf Coast north of Tampa. Debby’s slow forward speed enabled it to dump torrential rains across a widespread area, totaling more than one foot in some locations. The combination of a prolonged storm surge event and heavy rain from slow-moving Debby, caused widespread flood impacts, including memorable flooding along Tampa’s Bayshore Boulevard.


Tropical Storm Debby's prolonged surge and heavy rain flooded Tampa's Bayshore Blvd.
Photo: Jason Behnken

Debby’s slow speed also enabled more water to push into the Tampa Bay area; storm surge levels at McKay Bay Entrance exceeded 4 ft and reached 3.97 ft at Old Port Tampa.

 Tropical Storm Debby's storm surge and track map from the U-Surge Project


Based on the NHC intensity and track forecast, we should expect Colin to be more like Andrea than Debby, generating minor coastal flooding near Tampa Bay, and minor-moderate coastal flooding near Cedar Key and Apalachee Bay. As Colin is forecast to move through noticeably faster than Debby, rainfall totals should be generally lower and storm surge should not have as much time to build up in Tampa Bay.

Residents in this region should be accustomed to these flood impacts, as Colin is the third tropical storm in five years to take this similar track during the month of June.

Thursday, March 24, 2016

Why Palm Beach County Residents May be Unprepared for Storm Surge Flooding

On September 17, 1947, a category-4 hurricane struck southeast Florida, generating an 11-foot storm surge at Palm Beach (Barnes 2007). The sea water at Palm Beach on that date reached the highest recorded level, even topping a 9.8-foot storm tide generated by the "Lake Okeechobee Hurricane" of 1928 (Harris 1963). Both of these storms generated high enough storm surges to inflict substantial damage along the coast.


The 1947 Hurricane smashed the coastline of Palm Beach County with a powerful storm surge. This photograph of the Seacrest Hotel in Delray Beach was taken at the northwest corner of Ocean Boulevard and Atlantic Avenue. Image Courtesy: Florida Memory: State Library & Archives of Florida (https://www.floridamemory.com/items/show/38352).


In fact, since 1926, five hurricanes have generated coastal floods at least 7 ft high in Palm Beach County; this level was reached in 1926, 1949 and 1965, and exceeded by hurricanes in 1928 and 1947. However, all of these events occurred more than 50 years ago, as the area has enjoyed an absence of large storm surges over the past five decades. Why is this?

The absence of large storm surges in this region during recent decades partly has to do with climate and partly has to do with luck, randomness, chance or fortune (pick your favorite term).


Time series of storm surges near Palm Beach/ West Palm Beach from 1880- present. Larger chart available on Palm Beach/ West Palm Beach U-Surge page at: http://www.u-surge.net/palm-beach-west-palm-beach.html.

Climatologically, hurricane activity in South Florida was suppressed from around 1968-1994 due to a negative phase in a climate teleconnection called the Atlantic Multidecadal Oscillation (AMO). Climatic teleconnections are links between weather or pressure patterns and resulting weather phenomena, like hurricanes. El Nino is a familiar teleconnection.

The AMO relates to a temperature index of the Sea Surface Temperature (SST) in the Atlantic. When the AMO is in a positive (warm) phase, the SSTs are relatively high and hurricane activity generally increases. When the AMO is in a negative (cold) phase, however, SSTs are relatively low and hurricane activity generally decreases. The AMO was negative from around 1968-1994, meaning there was less activity in those years, followed by a more active period beginning around 1995 (
Kossin and Himont 2007). 


The AMO Index relates to average sea surface temperatures in the Atlantic Ocean. Negative phases, depicting colder than normal temperatures, occurred between 1900-1925 and approximately 1968-1994. These periods were preceded and followed by warm phases. Image: https://en.wikipedia.org/wiki/Atlantic_multidecadal_oscillation.


However, Hurricanes Hugo (1989) and Andrew (1992) were two major hurricanes that struck the Southeast U.S. during the AMO cold phase, which proves that these teleconnections relate to general correlation, but do not mean there will be an absence of powerful hurricanes.

Randomness also plays a role in hurricane impacts at a particular site, and Palm Beach has been a "lucky" location in recent decades, at least concerning hurricane storm surge.

​The 1990s saw Hurricanes Andrew (1992), Erin (1995) and Irene (1999) impact Southeast Florida, but none of these storms generated a substantial storm surge in Palm Beach County because of their their tracks and landfall locations. Hurricane Andrew inflicted catastrophic wind and surge damage in Miami-Dade County, as cat-5 winds and a 16.9 ft storm surge tore through areas south of Miami (Rappaport 1993). However, storm surge levels north of Fort Lauderdale were modest, and typically not even observed. Hurricane Erin made landfall well north of the area, near Cocoa Beach, so the strongest winds in Palm Beach County were blowing offshore. And Irene approached from the southwest, so the water it was pushing mostly impacted the Keys and Everglades.

In the 2000s, hurricanes continued to strike southeast Florida, inflicting the greatest damage on Palm Beach County in 2004. That September, Hurricanes Frances and Jeanne inflicted substantial wind damage on the county. However, since these storms made landfall near the county's northern border, the strongest winds in the area were blowing offshore and suppressing surge levels. Frances produced elevated water levels on the coast, with water levels at Lake Worth Pier reaching 6.3 ft above the NAVD88 datum (Wang and Manausa 2013). Within 10 miles of the Palm Beach/ West Palm Beach area, Jeanne produced a maximum surge of around 3.5 ft (National Weather Service 2010).


​Hurricane Jeanne struck much of Palm Beach County with maximum sustained winds exceeding 70 mph, however, the strongest winds were blowing offshore since Jeanne made landfall north of the area. Due to this track, Palm Beach County experienced substantial wind damage but relatively little storm surge damage. (Note: wind damage was greater in Martin County, to the north. Image printed in Wang and Manausa (2005).

Several more hurricanes followed in 2005, and although storms like Katrina and Wilma generated substantial wind and rain, their track and intensity were not ideal for generating large storm surges near Palm Beach.

This lack of large surges over more than five decades may leave many residents of Palm Beach County unprepared for saltwater inundations in the future.

Massive population growth in this region will substantially increase storm surge impacts even if future storm surges do not surpass the frequency or magnitude of surges in the past. From 1970 to 2014, Palm Beach County has grown by more than 400%, as the population increased from approximately 349,000 to 1,398,000 (U.S. Census 2014). That's an addition of more than one million people in 45 years.

This 2007 air photo depicts widespread suburban sprawl encroaching on a water-logged area of the northern Everglades in Palm Beach County. Massive population growth in recent decades places more people at risk from storm surge and sea-level rise. Image Courtesy Herald-Tribune Archive/ The New York Times.

Sea level rise has also increased the ocean level in recent decades, meaning a lower magnitude storm surge today could reach the same water levels reached in the 1960s, because the seawater has a head start. Unfortunately, many people along Florida's Atlantic coast may feel that sea level rise is an issue restricted to Miami-Dade and Broward counties, but will not affect Palm Beach County and points north.


Long story short, Palm Beach County is vulnerable to inundation from coastal flooding, but because of climatological factors and a bit of good luck, the area has avoided any substantial storm surges for more than 50 years. Many local residents are transplants who have never experienced a hurricane before, and long-timers likely think of hurricanes as wind events instead of storm surge events, given the history of the past five decades. We can only hope residents realize their luck will run out and salt water will once again inundate their coastal communities.


REFERENCES


Barnes, J., 2007: Florida’s Hurricane History, 3rd Edition, University of North Carolina Press, Chapel Hill, North Carolina, USA, 407 pp.


Harris, D.L., 1963. Characteristics of the Hurricane Storm Surge. United States Weather Bureau, Technical Paper No. 48. Available on the web at: http://www.csc.noaa.gov/hes/images/pdf/CHARACTERISTICS_STORM_SURGE.pdf.


Kossin, J.P., and D.J. Himont, 2007: A More General Framework for Understanding Atlantic Hurricane Variability and Trends. Bulletin of the American Meteorological Society, DOI: 10.1175/BAMS-88-11-1767.

​

National Weather Service, 2010: Hurricane Jean, Miami- South Florida Weather Forecast Office, Miami, Florida. Available on the Web at: http://www.srh.noaa.gov/mfl/?n=jeanne.


​Rappaport, E., 1993: Preliminary Report, Hurricane Andrew, 16-28 August, 1992. National Hurricane Center, Miami, Florida, USA. Link: http://www.nhc.noaa.gov/1992andrew.html.


​U.S. Census, 2014: Census of Population and Housing. Link: http://www.census.gov/prod/www/decennial.html.


​Wang, R., and M. Manausa, 2005: Hurricane Jeanne, Characteristics and Storm Tide Evaluation, Draft Report. Submitted by Beaches and Shores Resource Center, Florida State University, 11 pp. Link: https://www.dep.state.fl.us/beaches/publications/pdf/tropical/2004/strmtide/jeanne.pdf.


​Wang, R., and M. Manausa, 2013: SBEACH High-Frequency Storm Erosion Model Study for Palm Beach County, Final Report. Submitted by Beaches and Shores Resource Center, Florida State University, 52 pp. Link: https://www.dep.state.fl.us/beaches/publications/SBEACH/sbeach-PalmBeach-FinalReport1.pdf.

Wednesday, March 9, 2016

Storm System Showcases Heavy Rainfall Coupled with Prolonged Surge

A deep low centered over South Texas has dumped substantial rainfall over portions of Texas and Louisiana, while generating prolonged onshore winds and storm surge that has led to minor coastal flooding. As heavy rains continue today, this storm may showcase the combined effect of a heavy rain event coupled with a prolonged storm surge.

This storm was forecast to dump more than 10" (25 cm) of rain in some areas, as it pulls persistent bands of rain off the Gulf Coast. NOAA's 2-day QPF map issued Tuesday morning forecast 5-10" (12-25 cm) of rain from Tuesday- Thursday morning over portions of eastern Texas and western Louisiana.


NOAA's 2-Day QPF Map forecasted 5-10" (12-25 cm) of rain over portions of
Eastern Texas and Western Louisiana. 


Coastal flooding was already starting late Tuesday afternoon along the Texas Coast near the junction of Hwy 124 and 87, south of Winnie, according to Galveston County's Office of Emergency Management (@galvcountyoem).  Such flooding was accurately forecasted by the Houston-Galveston National Weather Service office, as Tuesday was the second consecutive day with strong onshore winds.

Coastal flooding was starting by Tuesday afternoon, according to Galveston County's Office of Emergency Management @galvcountyoem.


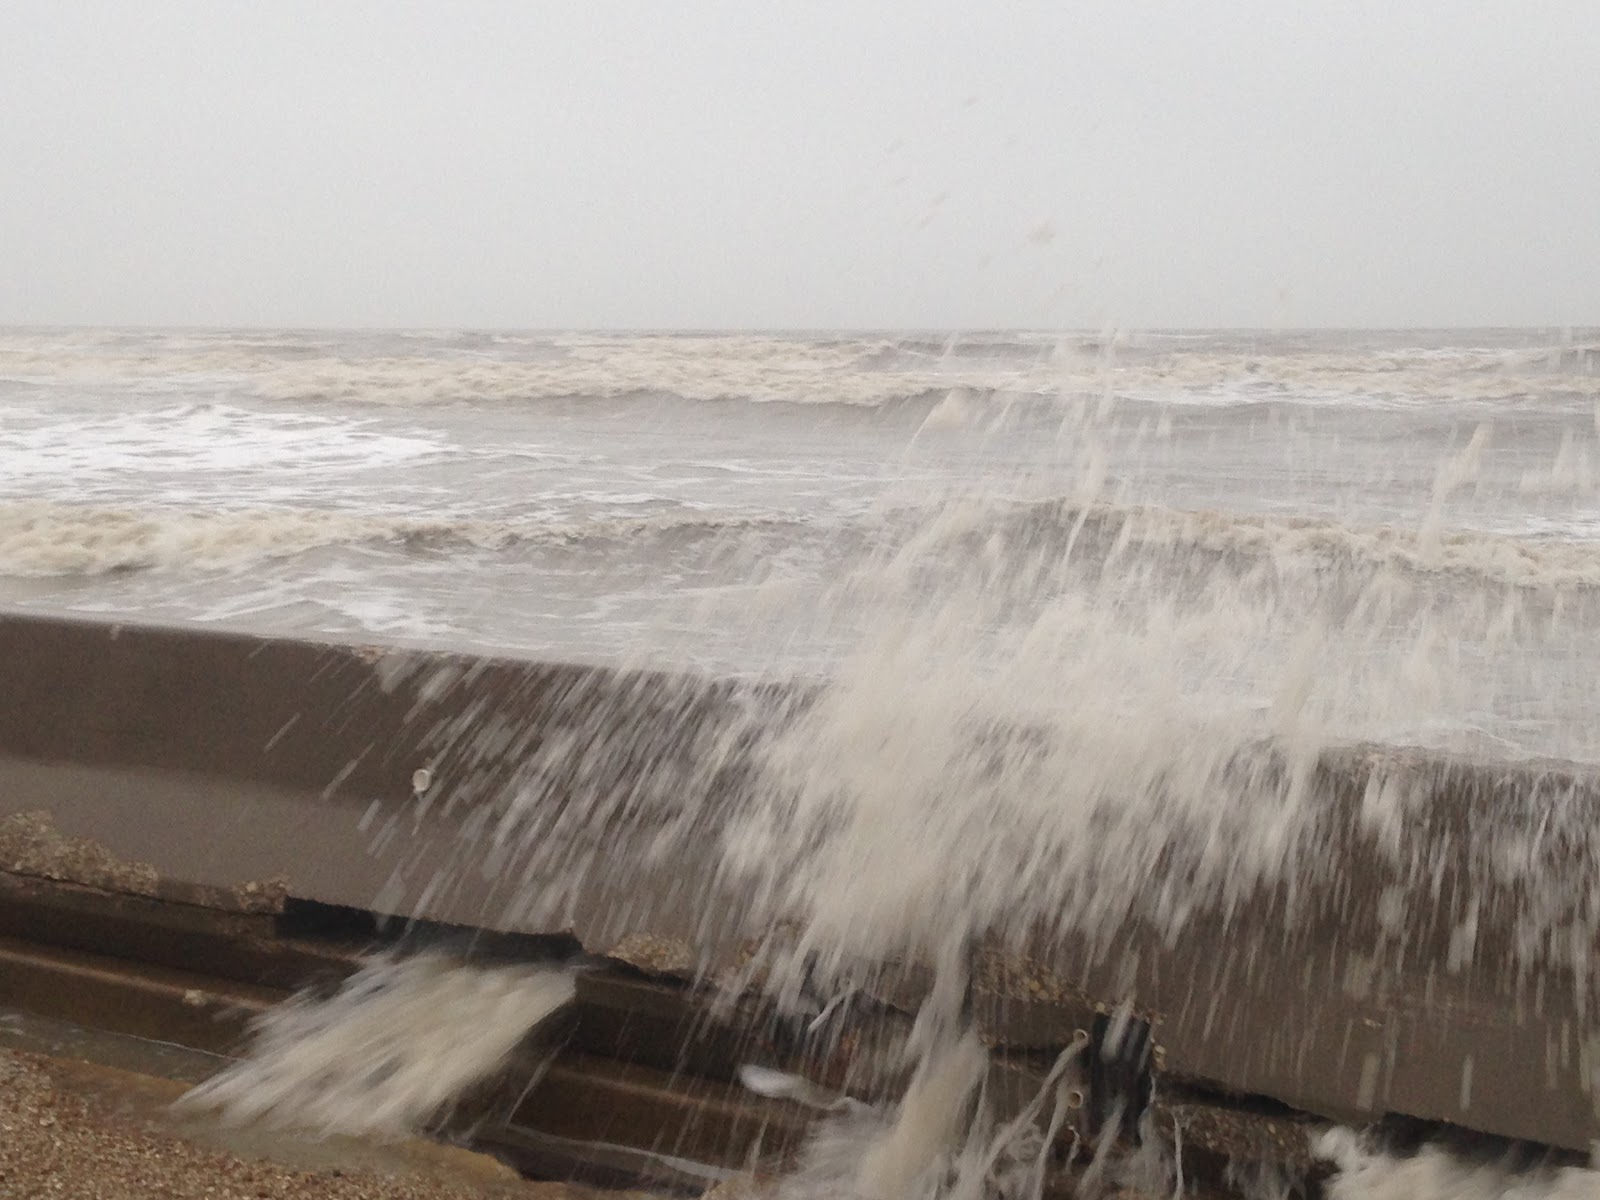
I went to this site this morning (Wed Mar 9) to document conditions on "Day 3" of this onshore wind event. Water was still washing over the seawall, but not as much as yesterday. No water was over Hwy 87 from Hwy 124 to the Ferry.

Some water was washing over the seawall at TX Hwy 87 and 124 this morning, but not as much as yesterday. Photo: Hal Needham

There was evidence that seawater had washed onto Hwy 87 earlier this morning, probably around the pre-dawn high tide. But by 7:00AM the water had receded. Photo: Hal Needham


Chaotic waves are common at Rollover Pass. Rough seas in the area this morning pushed waves over a wall near the TX Hwy 87 bridge. There was no standing water over the roadway.
Photo: Hal Needham

By late Tuesday afternoon, water levels at the north jetty of Galveston Bay were already around 1.3 ft above normal and rising, according to a NOAA tide gauge at that site. The strongest winds, and highest surge levels, were forecast for Tuesday night and early Wednesday morning, as the Houston-Galveston National Weather Service forecasted tide levels could exceed 3 ft (0.91 m) above normal at the height of the storm.

Strong onshore winds had already elevated the water level near the entrance of Galveston Bay around 1.3 ft above normal,as of late afternoon Tuesday. This graph depicts observed (red) and predicted (blue) water levels at NOAA's Galveston Bay Entrance North Jetty tide gauge.

The flood threat may be particularly high in coastal towns, where a prolonged storm surge will slow the drainage of heavy rain. Such drainage depends on sloping ground; the greater the slope the faster rainfall drains. Prolonged storm surges reduce this land to sea slope, and slow drainage, exacerbating flooding even well inland.

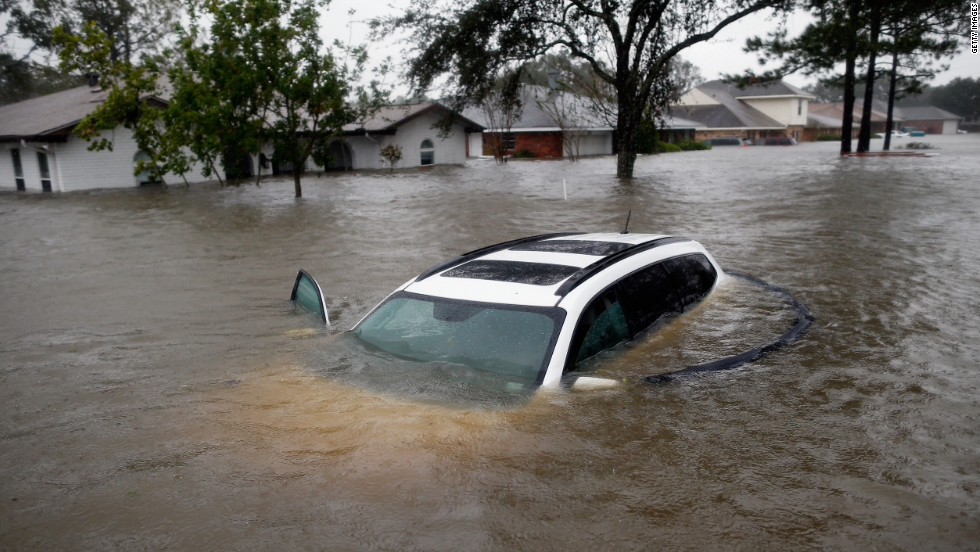
This scenario played out twice in 2012, as Tropical Storm Debby flooded Tampa, Florida, with a combined storm surge/ heavy rain event in June, and Hurricane Isaac followed with a similar event in Louisiana, in August. Isaac's flooding was more severe and impacted more people, as thousands north and west of New Orleans were forced to evacuate after torrential rain could not drain efficiently into the surge-elevated Lake Pontchartrain.


Combined heavy rainfall and storm surge flooded thousands of homes in Louisiana, during Hurricane Isaac, in 2012. This event flooded areas near Lake Pontchartrain that did not flood in Hurricane Katrina. Image courtesy CNN.

A Nature Climate Change article published in 2015 found that compound rain-surge events are increasing for many major U.S. cities, in part due to sea level rise. In the publication, Dr. Thomas Wahl and colleagues also found that such events are more common in the U.S. along Atlantic and Gulf Coasts than the Pacific Coast.

The authors mention that the combined effect of heavy rain and storm surge produces higher magnitude floods than either of the hazards occurring separately. This is an observation for which coastal urban areas should prepare, as rising seas enhance storm tide levels and reduce the rate of rainfall drainage.