Friday, September 8, 2017

What to Expect from Hurricane Irma's Storm Surge

As Hurricane Irma tracks towards Florida, millions of people have been making decisions based on wind and storm surge forecasts. This blog post discusses Irma's storm surge potential and looks back at Hurricane Donna (1960), which may provide some valuable insights.

Hurricane Irma traversed the southern Turks and Caicos Islands this morning as a strong category-4 hurricane. Irma continues to track WNW towards The Florida Straits.


National Hurricane Center Text Forecast

The National Hurricane Center (NHC) advisory on Hurricane Irma issued today (Fri Sep 8) at 500AM Eastern Time, provides a text forecast of potential storm surge heights. The forecast describes these surge heights as potential inundation levels above normally dry ground if the peak storm surge occurs around the time of high tide.

The NHC text forecast provides the following potential inundation levels:


Jupiter Inlet to Bonita Beach, including Florida Keys...5 to 10 ft
Bonita Beach to Venice...3 to 5 ft
Jupiter Inlet to Sebastian Inlet...3 to 6 ft

This forecast places the entire metro Miami area, the Florida Keys and the coastal Everglades in the 5-10 foot storm surge range.


National Hurricane Center Storm Surge Probability Tool

The NHC provides a storm surge probability tool that enables users visualize the likelihood of storm surge inundation above a user-defined threshold. This tool provides useful insights for people who are concerned about a certain water level, such as a storm surge level equal with their home elevation.

The map below depicts the likelihood of a 3-foot storm surge inundation, depicting a local maximum in South Florida of greater than 50% near the southwestern portion of the Everglades. Shallow bathymetry (offshore water depth) in this area will enable local storm surge maximums to develop on the "back" side of Irma, when winds blow from the southwest after Irma's closest approach.

Relatively deep bathymetry near the Miami area explains the low probability of inundation in that region.


Note the broad area shaded purple along the Georgia and SW South Carolina coasts. This depiction may seem surprising, but it is not a mistake.

Even though Irma is forecast to weaken as it moves inland along the Florida Peninsula, storm surge levels in places like coastal Georgia will likely exceed levels in places like Miami, which should observe more powerful winds. The concave shape of the coastline and shallow bathymetry enable storm surge to efficiently pile up from around Jacksonville north to Hilton Head Island, including the entire Georgia coast.

A major public awareness challenge in Irma will be helping people to look beyond the center of Irma's track and the "category" number, which is based on maximum sustained winds, but is not indicative of rainfall or storm surge threat. Life-threatening storm surge can be expected in places like coastal Georgia, even as Irma is downgraded to a lower-category hurricane or a tropical storm.

My blog post from last October titled, "The Protected Coast is now the most dangerous place of all", provides an overview of the surprising storm surge history along the Georgia and SW South Carolina coast. Although hurricane activity have been quiet there in recent decades, the area observed hyperactive hurricane climatology in the late 1800s, including a storm tide (storm surge + tide) as high as 12 feet in 1893 and 18 feet in 1898.

The Great Hurricane of 1898 generated a 16-ft (4.88 m) storm surge at Brunswick, Georgia, completely devastating the harbor. Although Irma's storm surge level will not likely reach this high in coastal Georgia, the region is starting to observe elevated hurricane activity, similar to the 1890s.


Last October, Hurricane Matthew generated a storm surge generally ranging from 4-8 feet in NE Florida, Georgia and SW South Carolina. The surge at Fort Pulaski, Georgia, reached 7.7 feet. In retrospect, Matthew may have provided some benefits, such as raising public awareness of storm surge risk, before Irma threatens to provide a greater inundation this year.


The National Hurricane Center Potential Inundation Tool

The National Hurricane Center Potential Inundation Tool provides users with a map that depicts possible inundation of normally dry ground, for the worst 10% of possible storm surge scenarios. In other words, based upon Irma's forecast track, size and intensity, if a model ran 100 possible storm surge scenarios, this map depicts the lowest level that was inundated at least 10 times.

In areas of the SW Everglades and SW portion of Biscayne Bay, east of Homestead, this level exceeds 6 feet above ground level. The zoomed in map below depicts the broad area vulnerable to storm surge inundation east of Homestead, as well as a narrow strip of land vulnerable to 3-6 foot storm surge inundation in the SW Miami metro region, including portions of Coral Gables and Coconut Grove.


This tool is not currently active for NE Florida, Georgia and South Carolina, but we can expect the mapped area to shift as Irma moves north. The storm surge probability tool and long-term climatology suggest that places like coastal Georgia will be a likely hot spot for Irma's storm surge, and local residents should begin taking action immediately to protect their lives and property from salt water flooding.


Insights from Hurricane Donna (1960)

These tools shown above are excellent additions that have been added in recent years to the NHC's suite of hurricane tools. They are generally based on modeling output from the SLOSH model.

In addition to these modeling outputs, it's important to reach back into observed storm surge history to provide some context for storm surge forecasts. Although every hurricane is different, historical data provide us with an opportunity to see geographic patterns in storm surge inundation and form some ideas about places where models may over- or under-predict storm surge levels.

Hurricanes King (1950), Donna (1960) and Cleo (1964) approached the Middle to Upper Florida Keys from the SE or SSE, and then tracked north along the Florida Peninsula. As I compared the characteristics of these storms to Irma, I chose Donna as an analog storm for comparison.


Hurricane Donna devastated the Florida Keys and much of the Florida Peninsula in 1960. Photo credit: Florida Keys Public Libraries.


Donna approached the Middle Florida Keys as a category-4 hurricane, with maximum sustained winds of 115 knots (around 132 mph). The center of Irma's circulation will take it near this area or farther east, but Irma is likely to be more intense, with forecast wind speeds in this region of 135 knots (around 155 mph).

Both Donna and Irma have comparable geographic size, which is important, because both maximum sustained winds and storm size influence storm surge levels. Irma's radius of maximum winds, which essentially measures the distance from the center of circulation to the eyewall, was holding steady at around 15 nautical miles last night, whereas Donna's radius of maximum winds was measured at 20 nautical miles.

The size of Irma's eye may fluctuate somewhat as it tracks towards Florida, but it seems that Irma and Donna generally have comparable sizes. By contrast, Hurricane King (1950) struck Miami as a small hurricane, with a tightly-wound radius of maximum winds only extending 5 nautical miles.

The U-Surge Project provides 92 storm tide observations for Hurricane Donna. The map below provides a plot of these observations, along with the hourly spline-interpolated hurricane position and wind speed, provided by Elsner and Jagger at Florida State University.


Donna's storm tide map provides a few interesting insights, as Irma approaches South Florida:

1) Donna generated a storm tide exceeding 12 ft to the east of landfall along the Florida Keys. Tavernier, Upper Matecumbe Key and Islamorada all observed storm tide levels exceeding 12 ft, with a maximum observation of 13.7 feet at Tavernier.

Irma's track will differ from Donna's and this means a different configuration of storm surge levels, as storm surge is sensitive to slight changes in a storm's track. Nonetheless, if Irma's forecast verifies, it has the potential to generate higher water levels than Donna in the Keys, and storm surge could reach around 15 feet, which exceeds the NHC text forecast by 5 feet.

2) Donna's map depicts numerous storm tide observations ranging from 4-8 feet in the Biscayne Bay area, just south of Miami. As Irma will likely make landfall farther east than Donna, with higher sustained winds and comparable size, Irma's storm tide near Biscayne Bay will likely exceed Donna's. We should expect storm tides of 6-10 feet near Biscayne Bay, and potentially higher than 10 feet if Irma's track brings the eyewall over the bay.

3) Donna tracked far enough west that it made a landfall in SW Florida. Irma will likely stay to the east of this. Therefore, Donna's 8-12 foot storm tide near places like Naples will not likely be reached in Hurricane Irma.

All of these observations are meant to provide context and should not be taken as a literal forecast. However, as hurricane/ storm surge models improve and the observational record grows, our confidence in storm surge prediction should continue to increase with time.

It's really too early to make an educated guess about storm surge potential in NE FL, Georgia and South Carolina. However, keep in mind that this area has all the ingredients to generate substantial storm surge inundation, even from a low-category hurricane or tropical storm.

I am doing Hurricane Harvey field work in coastal Texas today, but I will check email frequently if you would like to do an interview or if you have questions. Please contact me at hal@marineweatherandclimate.com.

Thank you for your interest in storm surge science and best wishes to everyone in Florida, Georgia and the Carolinas, who may be impacted by Irma!

-HH


Thursday, September 7, 2017

The U-Surge Project Launches Website for Miami

As Hurricane Irma approaches South Florida, the U-Surge Project has launched a storm surge webpage for Miami: https://www.u-surge.net/miami.html.

This page is open to the public and provides insights on both local storm surge history and long-term coastal flood risk, pulling data from 27 hurricanes and tropical storms over the  past 137 years (1880-2016). The website provides infographics, historic maps, information on extreme water level risk and a multi-media archive.

The picture below, taken from the multi-media archive, shows what a 15-foot storm tide looked like during the Great Miami Hurricane of 1926. This picture is one of the all-time great storm surge education/ awareness photos, because it shows that storm surge truly is a "dome of water" that pushes inland. Note how only the tops of the palm trees emerge from the salt water.

The Great Miami Hurricane of 1926 generated a 15-ft storm tide (storm surge + tide) in southern Miami. The U-Surge Project provides a multi-media archive of storm surge events in this area.


Some highlights of Miami's storm surge history

U-Surge provides some interesting insights into Miami's storm surge history:

-The Great Miami Hurricane of 1926 produced the highest storm tide (storm surge + tide) level, reaching 15ft (4.57m);

-Since 1880, three hurricanes have generated storm tide levels of at least 11.5ft (3.51m). The last was Hurricane Andrew in 1992;

-Irma's storm tide has the potential to keep company with these three largest events in recorded history. If Irma's storm tide exceeds Andrew's (11.81ft / 3.6m), it would be the highest storm tide level in Miami in 91 years;

-Based on a log-linear regression plot of data since 1880, the 100-year storm tide level in Miami is 14.61ft and the 15-ft storm tide in 1926 was a 108-year event.

Since 1880, three hurricanes have generated storm tide levels greater than 11.5ft (3.51m) in Miami.


The U-Surge Project will regularly update our time series plots as Irma approaches Miami, enabling us to put this storm surge event in climatological context.

At this point, the potential exists for a substantial storm surge near Miami, but slight shifts in Irma's track will produce large changes in storm surge levels. The offshore bathymetry (water depth) east of Miami is relatively deep, which means that strong hurricanes tracking just offshore are not able to generate large surges. Consider Hurricane Matthew, which tracked just offshore last year but generated a storm surge of only around 1 ft (.30 m) near Miami.

For hurricanes to generate large storm surges near Miami, the hurricane's eyewall needs to make a close approach to the city, and generally track over Biscayne Bay.  Major hurricanes (categories 3, 4 or 5) have enough power to rapidly displace water in Biscayne Bay, generating localized storm surge maximums in this area on the southern edge of metropolitan Miami. Hurricane Andrew tracked through this area as a category-5 hurricane and pushed a 16.7-ft (5.09-m) storm surge.

Fortunately, Andrew was a compact hurricane, enabling storm surge values to rapidly decrease away from the storm center. In the southern part of Miami (near northern Biscayne Bay), surge levels reached 11.81 ft (3.6 m) and the surge was negligible from Fort Lauderdale northward.


The Great Miami Hurricane of 1926 made landfall as a category-4 hurricane just south of Miami, and generated a 15-ft (3.57-m) storm tide in the southern portion of the city.


At this point it appears that Irma has the potential to make landfall near or south of Miami, which would enhance storm surge levels.

U-Surge has launched this archive of graphics, maps and multi-media resources to help with public awareness of local storm surge risk as Hurricane Irma approaches. Raw datasets and statistical/ mathematical analysis for professional use are available through collaboration/ consulting initiatives with U-Surge.


Wednesday, September 6, 2017

Cat-5 Irma Threatens Northern Caribbean and Southeast U.S. with Destructive Storm Surge


MAIN POINTS

1) Hurricane Irma has already generated an 8-foot storm surge on Barbuda and is forecast to generate a 15-20 foot storm surge in the Turks and Caicos and Southeastern Bahamas;

2) Irma will bring the third destructive storm surge to the Bahamas in three years and may rival Hurricane Joaquin's 15-ft (4.57 m) storm surge, which also struck the southeastern Bahamas two years ago;

3) Irma is forecast to remain a powerful category-4 or -5 hurricane as it approaches the Florida Peninsula. The most reliable models predict a sudden turn towards the north, but uncertainty is fairly high regarding the timing and track of that turn, as well as potential impact to Florida and/or other southeastern states;

4) All interests from Florida through North Carolina should closely monitor the progress of Hurricane Irma. The region from northeast Florida (St. Augustine) through all of the Georgia coast and southwest South Carolina is particularly vulnerable to storm surge, whether or not Irma makes a direct landfall in that region.

Hurricane Irma threatens to strike the northern Caribbean and Southeast U.S. with a destructive storm surge


NORTHERN CARIBBEAN

Powerful Hurricane Irma made landfall in the northern Leeward Islands last night, making a direct hit on Barbuda. At the time of landfall, Irma's maximum sustained winds were estimated at 185 mph.

A NOAA Tides and Currents tide gauge in southwest Barbuda observed a storm surge of 7.95 ft (2.42 m), shortly after the eye crossed the island and intense winds changed direction. For much of the afternoon and evening, northwest winds increased in velocity, but on the back side of the eye, intense winds from the south-southwest caused a rapid rise in sea levels.

The NOAA Tides and Currents gauge on Barbuda remained operational through most Irma's passage last night, providing valuable wind, air pressure and water level data.


This station observed maximum sustained winds from the northwest at 103 knots, gusting to 134 knots at 1:54AM local time. The minimum pressure bottomed out at 921 mb at 2:18AM, followed by a maximum storm surge at 3:12AM, as air pressure rapidly began rising and winds shifted from the south-southwest.


Storm surge levels spiked at the NOAA Tides and Currents gauge on the southwest coast of Barbuda, after winds changed direction and rapidly pushed a storm surge in from the south-southwest.


As Irma tracks north of Puerto Rico and the Dominican Republic, and is expected to make a direct landfall on the Turks and Caicos, as well as the Southeastern Bahamas, variable storm surge levels are forecast throughout the region.

The highest storm surge levels are expected in the Turks and Caicos, and the Southeastern Bahamas. In these areas surge levels could reach 15 to 20 feet, particularly where broad, shallow lagoons are situated upwind of islands. Along the northern coast of the Dominican Republic and Puerto Rico, storm surge levels are forecast to range from 3 to 5 feet.


Storm surge forecast from the National Hurricane Center, as Wed Sep 6 at 700 Eastern Time.


Irma threatens to generate a destructive storm surge in the hurricane-weary Bahamas, where substantial salt-water inundation is likely to occur for the third consecutive year.


In 2015, Hurricane Joaquin struck the southeast Bahamas with a 15-foot (4.57 m) storm surge at Crooked Island. Irma may generate a severe storm surge that rivals Joaquin's in this same region of the Bahamas.

The broad reef-lagoon features of the Bahamas make it more susceptible to storm surge inundations than most places in the Caribbean. Broad lagoons in parts of the Bahamas stretch for more than 10 miles (16 km) in one direction, providing large, shallow pools of water that powerful hurricanes can displace locally. Storm surge builds more efficiently where water depths are shallow, and these reef-lagoon systems provide a setup for rapid storm surge generation.

Hurricane Joaquin devastated the southeast Bahamas with destructive winds and a storm surge reaching as high as 15 ft (4.57 m) in 2015. 


UNITED STATES

Irma is forecast to remain a powerful category 4- or 5 hurricane as it approaches the Florida Peninsula. The most reliable models predict a sudden turn towards the north, but uncertainty is fairly high regarding the timing and track of that turn, as well as potential impact to Florida and/or other southeastern states.

The GFS (American) model run from 200AM Eastern Time this morning generally shifted Irma's track to the east. The graphic below shows the GFS ensemble model run, with the black line depicting the ensemble mean. This model run shows why coastal interests as far north as North Carolina should closely monitor Irma.

GFS (American) model run from 200AM eastern time this morning. The ensemble mean track (black line) has shifted east of the Florida coast.

The ECMWF (European) model run from 800PM Eastern Time yesterday evening depicts a model ensemble mean that is slightly west of the GFS model, generally taking Irma closer to the southeast Florida coast, and potentially making a landfall. This model run also indicates the possibility of elevated wind/ storm surge threat for Georgia and South Carolina.


ECMWF (European) model run from 800PM eastern time yesterday evening shows an ensemble mean approaching the southeast Florida coast.

These two reliable global weather models show why all interests from Florida through North Carolina should closely monitor the progress of Irma.

I am particularly concerned about storm surge impacts in the following places:

1) Florida Keys or Southeast Florida IF Irma makes landfall in these places;

2) South Carolina/ North Carolina coast, east of landfall location IF Irma makes landfall here;

3) The stretch of coast from northeast Florida (St. Augustine) through all of coastal Georgia and southwest South Carolina, WHETHER OR NOT IRMA MAKES LANDFALL HERE. Even if Irma does not make a direct landfall in this region, the shallow bathymetry (offshore water depth) and concave coastline shape in this region is very efficient for generating high storm surges and Irma may generate a destructive storm surge here.

I will write more about this in my next post.

-HH


Wednesday, August 30, 2017

Horrors Beyond Horrors Unfolding in "Golden Triangle" of Beaumont- Port Arthur- Orange, Texas


Torrential rains have pounded the Beaumont-Port Arthur-Orange region for the past 9-12 hours. This will continue for atleast three more hours. Rainfall rates have approached 4-6" per hour in the heavier cells. Radar image: Weather Underground WunderMap


Horrors beyond Horrors-

I will make this a quick post. The worst conditions faced in Harvey unfolded overnight and is still unfolding this morning in the "Golden Triangle" of Beaumont- Port Arthur- Orange.

Harvey made a second landfall near here, and torrential rain has been literally spinning over the same areas for 9-12 hours now. Rainfall rates have reached 4-6 inches an hour at times.

Extreme rainfall knocked out dish-tv and other utilities. Many quickly became cutoff from most information sources.

I set up Facebook group to connect people and 800+ joined within 2 hours. The messages have been horrific.

Messages like, "EXTREME CRISIS! THIS IS AN OLDER COUPLE! Just spoke to [Name]. Says water up to shoulders. Will try to get on roof of house."

I promise I am not exaggerating when I say at least hundreds, if not thousands, of people are fighting for their lives right now.

Any rescue equipment- particularly boats- are desperately needed right now. Worst hit areas over night seem to be Nederland and Port Arthur- but extremely bad in Beaumont and points north now.

Even if you are in Arkansas, Louisiana or Mississippi, if you can get a boat to this area, I guarantee that there will be more people than you could possibly rescue two days from now. Normally a major response would be launched for Beaumont-Port Arthur-Orange, but regional resources are strained with Houston under water. Also, it's not possible for help to arrive here from the west because it's impossible to travel from west-to-east across Houston.

The scale of this is incomprehensible. It's as if the entire states of Connecticut and Rhode Island are submerged and two or three counties are fighting for their lives.

We aren't hearing these people crying out because they have no voice. Many have lost power, in the best case have made it to a roof. The eyes of the world are on Houston and these smaller cities in southeast Texas are crying out and nobody can hear them.

-HurricaneHal

Tuesday, August 29, 2017

U-Flood Project Provides Near-Real Time Flood Mapping from Hurricane Harvey


Galveston-based Tailwind Labs and Marine Weather and Climate have launched the U-Flood Project to provide near real-time mapping of flooded streets during Hurricane Harvey. Link: www.u-flood.com

The project provides a crowdsourced mapping platform for the Houston metro area, as well as the I-45 corridor, Galveston, Beaumont/ Port Arthur, Lake Charles, Baton Rouge and New Orleans.

Real-time mapping is crucial right now as first responders are still in rescue mode- trying to locate and save flood victims.

Here's how you can help:
1) Map it: Click on a city image and start mapping flooded streets. Even if you just map the street in front of your house, the collective effort of thousands of users will construct a near-real time map of current flooding!

2) Tell others: Tell everyone you know to use U-Flood on their phones or computers.

3) Donate: Please consider donating to this project on Patreon so we can keep expanding our resources as this catastrophe unfolds. We have a donate button on the bottom of the U-Flood homepage. Even a $10 gift will help so much!

Thank you!
-Hurricane Hal

Monday, August 28, 2017

Harvey "Round 3" Starts Today

HURRICANE HARVEY UPDATE
MON AUG 28 630AM CENTRAL TIME
Main Point: Harvey “Phase 3” Starts today!
Perspective:
Phase 1: Fri Aug 25: Extreme wind damage near Rockport and moderate storm surge along Central TX coast;
Phase 2: Sat Aug 26-Sun Aug 27: Extreme, persistent rainfall causes catastrophic flooding, particularly in metro Houston and along I-45 corridor SE of Houston;
Phase 3: Mon Aug 28-Tue Aug 29: Strong winds build in metro Houston, I-45 corridor SE of Houston, Galveston area and Houston-Beaumont corridor. Banding of extreme rainfall rates and isolated tornadoes shifts east to Beaumont-Lafayette corridor

Timing:
Developing Monday morning through Tuesday night

Hazards:
-Strong winds developing in Houston-Galveston corridor, Galveston Island, Bolivar Peninsula Houston-Beaumont corridor;
-Persistent, moderate rain, with isolated downpours in metro Houston and I-45 corridor SE of Houston
-Heavy banding/ training of rain, with embedded tornadoes, shifts east to Beaumont/ Port Arthur through Lafayette, LA
-Storm surge levels build in Galveston/ Galveston Bay, Bolivar Peninsula, to Cameron, LA. Not expecting a huge surge, but water levels could be 2-4 feet above normal. This will impede the runoff of torrential rains.
-Massive runoff of torrential rainfall will keep bayous/ creeks/ rivers rising...rain has stopped in Conroe-Liberty region, but torrential rain to north will drain through this area and rapidly rise creeks, bayous and rivers

Impacts:
-Widespread power outages for Houston/ Galveston corridor, east through Beaumont/ Port Arthur. This includes Galveston Island, which has not experienced the most severe impacts of this storm yet;
-Widespread wind damage for Houston/ Galveston corridor, east through Beaumont/ Port Arthur. Nothing like the damage to Rockport area from hurricane-force winds. The winds from Harvey over next two days may exceed 40mph sustained with gusts to 60mph;
-Expect considerable tree falls in Houston-Galveston corridor and Houston-Beaumont corridor, as trees are now rooted in soggy soil and have been stressed for days;
-Expect scattered roof damage and collapse of less sturdy construction, like carports and awnings over gas station pumps...some flying debris possible;
-Very rapid flash flooding from new squall lines, especially from Beaumont/ Port Arthur east through Lafayette

Take Action:
-Prepare to lose power, particularly in Houston-Galveston and Houston- Beaumont corridors, including Galveston Island;
-Expect power could be out for at least several days, as many places are cut off (including Galveston Island) and power crews cannot access them;
-Expect tree falls in this same region. Watch your proximity to large trees and branches- if possible stay "upwind" from large trees;
-Have a flashlight and, if possible, battery-powered radio near you;
-From Beaumont/ Port Arthur through Lafayette, LA keep an eye on squall lines and prepare for isolated tornadoes.

Stay safe everyone....hazardous weather will continue in the region until at least Tuesday night!

-Hurricane Hal
hal@marineweatherandclimate.com

Saturday, August 26, 2017

Perspective on Harvey's Storm Surge and Widespread Flood Threat

Hurricane Harvey made landfall near Rockport, Texas, as a category-4 hurricane yesterday evening. This blog post provides some insights on Harvey's storm surge and widespread flood threat.


Highest Surge

Harvey's highest storm surge occurred east of Rockport. We should expect a long-term, severe storm surge as far east as Matagorda Bay, where strong onshore winds are continuing to push a substantial storm surge into places like Port Lavaca.

A NOAA Tides and Currents gauge at Port Lavaca, Texas, reported an observed storm tide level of 7.0 feet above Mean Sea Level (MSL) at 3:48AM Central Time. Unreported storm tides in this region likely reached as high as reached 10-12 feet.

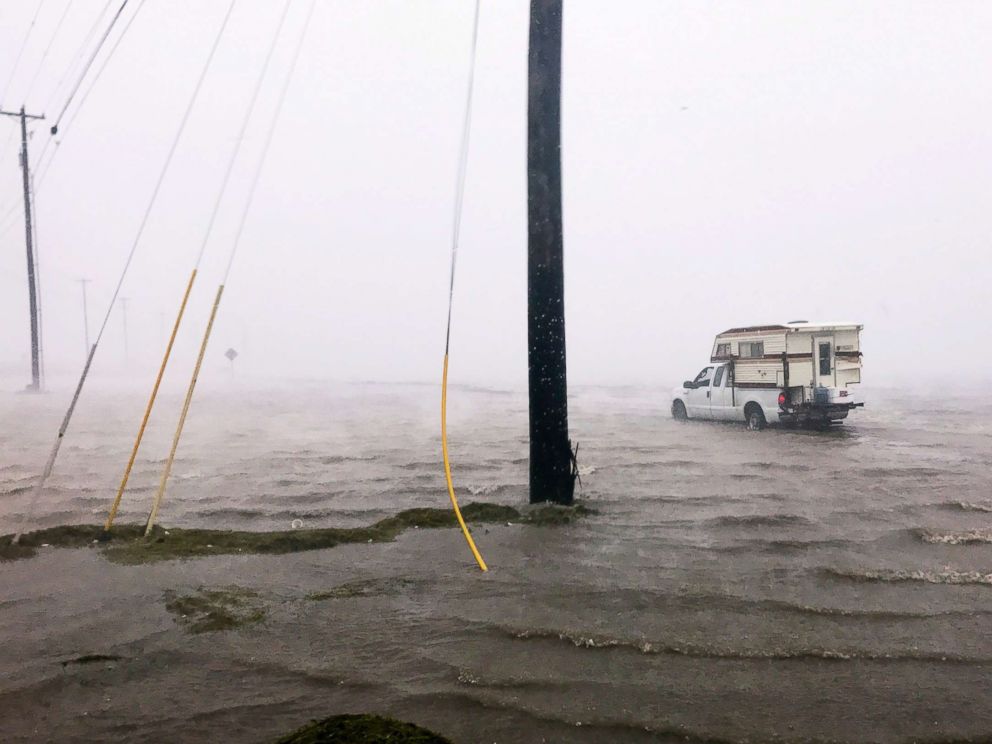
Harvey's storm surge and torrential rains are flooding a widespread area of the Central Texas Coast and portions of inland Texas. Image: ABC News


Port Lavaca

Harvey has generated the highest storm surge at Port Lavaca since Hurricane Carla (1961). However, Harvey's storm surge level in this area is not as rare as we might believe, and it may come in 5th place for all surges since 1919. What's exceptionally rare about Harvey is that this storm surge will combine with a stalling storm and tremendous rainfall, which will generate catastrophic flooding.


Time series of storm tide (surge + tide) levels at Port Lavaca above Mean Sea Level (MSL) from 1900-2017 (118 years). Hurricane Harvey likely generated a 10-12 foot storm tide near Port Lavaca, although the highest observed level reported was 7.0 feet above MSL on Sat Aug 26 at 3:48AM CDT. Harvey generated the highest storm tide at Port Lavaca since Hurricane Carla in 1961, and the 5th highest storm tide since 1919. Observations are graphed chronologically from oldest (left) to newest (right). Absence of low-magnitude storm tide events before Ella (1958) is influenced by under-reporting, and does not necessarily indicate a lack of actual storm tide events. 


Compound Flooding

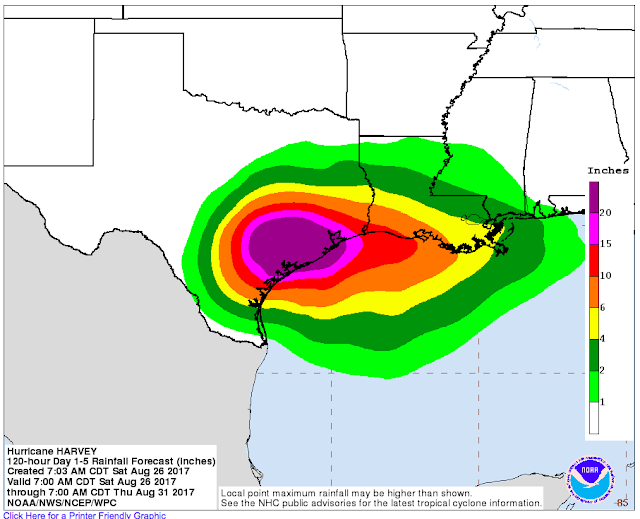
To the east of the storm center, onshore winds will keep storm surge levels elevated and impede the drainage of heavy rainfall. This will be a major problem, as Harvey is forecast to dump 20 or more inches of rain across a widespread area over the next week.


NOAA QPF Rainfall forecast map depicts 20 or more inches of rain across a widespread area over the next week.


Highly Variable Storm Surge Levels

Storm surge levels closest to Harvey's center of circulation will be highly variable, depending upon wind direction. As Harvey is forecast to drift for several days, a change in the center of circulation by even a few miles can change the wind direction from offshore to onshore in places. Areas closest to Harvey's circulation center may see rapid water level rises and falls as wind direction changes from offshore to onshore, and vice-versa.

For example, the storm surge level was about 1 ft below normal at Rockport around 2:00AM today, but then began rising rapidly to around 0.8 ft above normal by around 3AM, when the tide gauge failed.


Water levels in places like Rockport, Texas, have been highly variable. Areas closest to Harvey's circulation center may see rapid water level rises and falls as wind direction changes from offshore to onshore, and vice-versa. The red line in this graph is observed water level and the blue line is predicted water level, based on astronomical tides. Source: NOAA Tides and Currents.


Houston/ Galveston/ Freeport

Farther east from the center of circulation, around the Houston/ Galveston/ Freeport areas, expect persistent onshore winds with strong squalls today. The squalls will likely be separated by periods of multiple hours with no rain. Depending on Harvey's track, onshore winds and rainfall may increase in this area from late Sunday through Tuesday, which would increase flood potential.

Tornadoes most often are spawned in these bands well east of the circulation. Hurricane Carla (1961) made landfall in the Port Lavaca region, but generated several powerful tornadoes that caused substantial damage in Galveston.


Strong squalls of rain and wind will occur east of Harvey's circulation center. Such squalls produce torrential rain and sometimes spawn tornadoes. Image: Weather Underground Wundermap- accessed Fri Aug 25, 2017.

If Harvey tracks northeast after stalling, the threat of strong onshore winds and heavy rainfall will increase in this region. Prolonged onshore winds even below tropical storm force could elevate places like Galveston Bay by several feet for multiple days. Even a modest storm surge in this area could exacerbate flooding, as a prolonged storm surge of 2-4 feet in Galveston Bay will impede the drainage of torrential rainfall.


Larger Perspective on Coastal Flooding and Extreme Events

Harvey has struck an area that has observed multiple major hurricane strikes and storm surge events in the past century. Prior to Harvey, four hurricanes have generated storm surges of at least 13 feet at Port Lavaca, but none since Hurricane Carla (1961), 56 years ago.

Harvey is a classic example of why we need to know our hurricane history. From a storm surge perspective, this event may seem exceptional along the Central Texas Coast, but in the bigger picture it may end up more like a 20-25 year storm surge event (surge level we should expect every 20-25 years on average). Again, what is truly exceptional about Harvey is the likelihood of it stalling and dumping tremendous rainfall, which will be coupled with a long-term storm surge.

Harvey is striking one of four areas along the U.S. coastline that concern me because they have observed severe hurricanes and storm surges in the past, but not in recent history. Here are the areas that concern me most:

1) Georgia and Southern South Carolina:
This area observed hyperactive hurricane strikes and severe storm surges in the late 1800s, but nothing of that magnitude since 1898. The area south of Charleston concerns me the most, because they were on the "weak" side of Hurricane Hugo (1989) and did not experience Hugo's massive surge.


The Great Hurricane of 1898 generated a 16-ft (4.88 m) storm surge at Brunswick, Georgia, completely devastating the harbor.

2) Palm Beach/ Fort Lauderdale, Florida:
This area observed large surges in 1928 and 1947 and has had many near misses. Hurricanes Frances and Jeanne, both in 2004, made landfall just north of this region, keeping it on the weaker side and forcing the strongest winds to blow offshore. Hurricane Andrew (1992) was a powerful, but geographically compact hurricane the made landfall south of Miami and did not generate substantial surge in Fort Lauderdale or Palm Beach.


The 1947 Hurricane smashed the coastline of Palm Beach County with a powerful storm surge. This photograph of the Seacrest Hotel in Delray Beach was taken at the northwest corner of Ocean Boulevard and Atlantic Avenue. Image Courtesy: Florida Memory: State Library & Archives of Florida. (https://www.floridamemory.com/items/show/38352).

3) Florida West Coast, especially Tampa/ St. Petersburg:
This area is setup for a massive storm surge event with an astronomical impact because the bay is highly developed, with relatively minor flood protection. Storm surge models suggest a surge exceeding 20 ft (6.1 m) could strike the bay, if a hurricane tracked in from the southwest and made landfall north of St. Petersburg/ Clearwater.

Two hurricanes struck the area in 1848, both generating surges that exceeded 10 ft. The last substantial storm surge in this region occurred in 1921, when a hurricane generated a 10.5 foot surge.


4) Central Texas Coast:
Hurricane Harvey is currently striking the fourth region that concerns me.

Port Lavaca had observed four storm surges exceeding 13 ft in the past century, but nothing higher than 6.9 ft since 1961.

Corpus Christi, the largest city along the South-Central Texas Coast, shares a disturbing history of hurricanes and storm surges. The city has observed seven storm surges that have exceeded 7.9 ft in the past 102 years, or about 1 surge every 15 years over that threshold. But none of them have occurred in the past 37 years, since Hurricane Allen in 1980.


Corpus Christi has observed  7 storm surges that have exceeded 7.9 feet in the past 102 years, but none since Hurricane Allen (1980), which struck 37 years ago. 

Long periods of relative calm often lead us to underestimate our risk.

As I told a reporter on the phone yesterday, our foremost problems are public perception and lack of awareness. Once we truly understand our risks, widespread support for coastal protection rapidly increase, and funding these projects follows.

Notes: I usually write well-referenced articles, but as Harvey is impacting our area, I do not have time to add references/ citations right now to this blog. If you have any questions about Harvey or anything related to coastal flooding in general, shoot me an email and I will try to get back to you ASAP.

For the most frequent updates, check out the U-Surge Hurricane Harvey page: https://www.u-surge.net/hurricane-harvey.html.

Thunder starting again and lights flickering, so I guess that means I'm done here!

I hope I can access email on my phone.... contact me at: hal@marineweatherandclimate.com

Stay safe, much love, and thanks for reading!

-Hal