Wednesday, March 2, 2016

Bigger Perspective on Fiji's TC Winston and a Lesson on Resilient Construction


Tropical Cyclone Winston ravaged the islands of Fiji 11 days ago, pummeling the islands with category-5 winds. The death toll from this storm has reached 42, according to a Monday blog post from Jeff Masters and Bob Henson. Their blog post also provides early estimates of economic losses.

NOAA satellite image of category-5 Tropical Cyclone Winston bearing down on Fiji


While this is the deadliest cyclone in the modern history of the South Pacific, a cyclone more than 400 years ago killed 1000-2000 people in the Cook Islands (De Scally 2008), presumably from a massive storm surge. While comparison to the Cook Islands cyclone, which struck a long time ago, does not make it any easier for those recovering from Winston, it does provide perspective that human losses in the region have been even greater than this before. Technological advances, and the excellent work by the Fijian Government to warn people of Winston's approach, likely reduced potential fatalities considerably.

In addition to loss of life and immediate economic losses, cyclones in this region often inflict long-term impacts related to loss of food and water supplies, as it is difficult for islands to replenish these resources after a salt-water inundation (Needham et al. 2015).

Winston's category-5 winds pushed surge and high waves onto the Fijian Islands on Sat Feb 20.

The power of social media to connect people after a disaster became evident after I posted photos last week providing evidence of a 10 ft (3 m) storm surge in coastal Fiji. I implored blog readers to help identify the locations of the photos, which would enable us to get an early read of the surge inundation.


I posted this photo last week, which provided evidence of a 10 ft (3 m) storm surge in Fiji.
Original Photo: NZ Defence Force

Soon after my post, I received a message from Brooke Langston, a former Peace Corps volunteer in the Ministry of Fijian Affairs from 2013-2014. Brooke made contact with Fijians who were familiar with the locations of the photos, and I soon found out that the photos with the high water marks were from a village on the island of Vanua Balavu, the third largest island in the Lau archipelago.


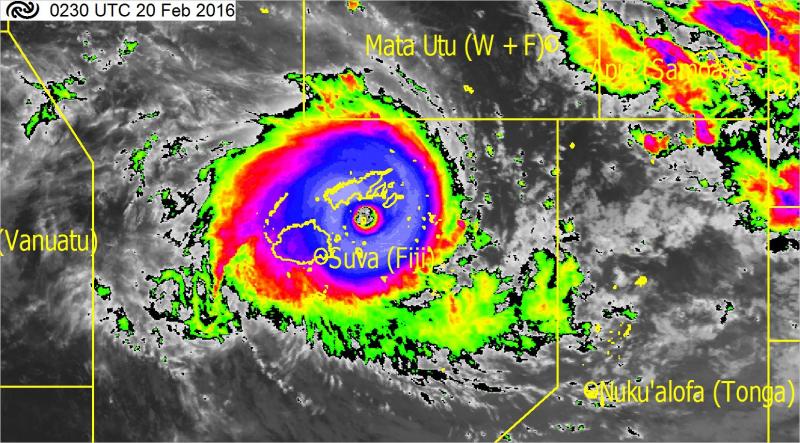
 Satellite Image: Himawari-8 satellite
Graphical edits: Hal Needham

The center of Winston's circulation tracked close to Vanua Balavu, and the satellite image above shows that Winston's eyewall was pummeling the island, with vicious winds from the southeast when the photo was taken (TC circulation in Southern Hemisphere is clockwise).

John O’Leary (@OLjohnel) provided a link to a Fijian government site that provided lat and lon values of many air photos (see @FijiRepublic). Through these sources, we are able to form a better picture of storm surge inundation.

Despite Winston's catastrophic losses, not all news coming from Fiji is bad.  A Radio Australia article emerged discussing how the 164 homes built by Peter Drysdale in Koroipita survived the cyclone with little damage. According to Drysdale,  the use of steel strapping coils and roofing screws provide stronger construction to endure cyclonic winds.


Peter Drysdale's 164 homes that survived Tropical Cyclone Winston with minimal damage.
Photo courtesy Joe Yaya and posted to Radio Australia Webpage.


We can read more about the fascinating story of how Drysdale built simple, but sturdy, homes for many of Fiji’s poorest in this story by the Australian Broadcasting Corporation. Drysdale claims that these buildings can be constructed in five days and only cost $13,000 Australian dollars ($9,414 U.S. dollars) to construct ($13,000 was quote from most recent article; the article from 2015 quoted $12,000....but hey, inflation is real).


Peter Drysdale supervised the construction of 164 houses that were built for many of Fiji's poorest people. These structures performed very well in Tropical Cyclone Winston.
Photo Courtesy Australian Broadcasting Corporation.


This story provides a few important take-home messages. One lesson learned is that adapting construction for violent cyclones and the bigger picture of climate change does not have to be cost prohibitive. Another lesson is that it is clear Drysdale constructed these homes to withstand powerful cyclones, and when they were tested, they stood.

This should cause us to ask if the homes in our coastal communities are constructed with powerful cyclones in mind, or if we consider such events too rare to consider. Such questions will become increasingly important due to the changing climate along our coasts.


The 2015 ABC article  reveals that many people interested in Peter's homes are climate change refugees moving from the country to the city, or even coming from other island nations, like Kiribati. Clearly this innovative project should stand as a model of a practical project to improve coastal resiliency in areas prone to tropical cyclone/ hurricane strikes.


REFERENCES

De Scally, F. A. (2008), Historical tropical cyclone activity and impacts in the Cook Islands, Pac. Sci., 62, 443–459.


Needham, H.F., B.D. Keim, and D. Sathiaraj, 2015: A Review of Tropical Cyclone-Generated Storm Surges: Global Data Sources, Observations and Impacts. Reviews of Geophysics, 53, 2, 545-591.

Monday, February 22, 2016

Tree Photos Provide Evidence of a 10-ft (3 m) Storm Surge in Fiji

Severe Tropical Cyclone Winston struck Fiji over the weekend as a monster cyclone with maximum sustained winds of 185 mph at landfall. This makes Winston the strongest recorded cyclone in the Southern Hemisphere, and tied for the third highest wind speed at landfall, according to Jeff Masters’ Wunderblogpost from Saturday.

According to ABC News in Australia, the cyclone has now killed at least 21 people.

Severe Tropical Cyclone Winston as it approached landfall on Viti Levu on Sat Feb 20, 2016.
Image courtesy MetService New Zealand.

Air photos provide initial evidence of a storm surge of approximately 10 ft (3 m) in some coastal areas. More specifically, these high water marks are actually a combination of storm tide and waves, as tree bark removal is the primary means for such observations in the first days following a severe cyclone.

Post-storm photographs often show a sharp color distinction on many trees at around the same level. The power of water rapidly racing past the tree will rub off tree bark, and leave behind evidence of maximum water levels. In the photographs below, I've drawn arrows pointing at these lines. The color on these trees is grey below the line and brown above it. I think the arrow farthest on the right in the first photograph most clearly demonstrates this contrast.

We can use other trees and the features on the buildings, like doors and windows, to get a rough idea of the scale. It appears that the height of tree bark removal is around 10 ft (3 m) in these photos, although future field work could more accurately make these measurements.


Sharp contrasts in tree trunk color indicates the height of extreme water levels at this location in coastal Fiji.
Original Source: NZ Defence Force; Edits from Dr. Hal Needham


Sharp contrasts in tree trunk color indicates the height of extreme water levels at this location in coastal Fiji.
Original Source: NZ Defence Force; Edits from Dr. Hal Needham


The use of tree bark removal as a proxy for extreme water levels has been established as a credible field work technique, and has emerged as a useful practice in areas without operational tide gauges.

Dr. Hermann Fritz, Associate Professor of Engineering at Georgia Tech University, led a reconnaissance effort to measure extreme water levels in three states following Hurricane Katrina in 2005 (Fritz et al. 2008). Measuring the height of tree bark removal was one field method that was most useful in many cases, enabling them to measure extreme water levels that exceeded 26 ft (7.92 m) in some cases. See my previous post about this and other field methods.

A 25.1-ft (7.65-m) rod does not quite reach the height of tree bark removal on East Ship Island, Mississippi, following Hurricane Katrina. The tree bark removal at this site extended to 8.2 m (26.9 ft), indicating an extraordinarily high storm surge at this location. Photo provided by Dr. Hermann Fritz.

Aslak Grinsted, an assistant professor at the Niels Bohr Institute, utilized tree photos to quite accurately estimate maximum water levels from Super Typhoon Haiyan in the Philippines in 2013. This blog post provides the story of how this researcher in Denmark used modern technology to estimate water levels in the Philippines.

As Winston approached Fiji, waves offshore were reported as high as 39 ft (12 m), according to the New Zealand Herald and BBC News. Many places in Oceania commonly observe extraordinarily high waves, but modest storm surge heights, because the bathymetry, or offshore water depth, is relatively deep in this region of the world. 

Waves smash over a seawall at Uprising Beach Resort, west of Suva, Fiji, on Sat Feb 20. Offshore waves reached as high as 39 ft (12 m). Photo Courtesy ABC News Australia.

It is likely that higher water marks will be observed, as Fiji is an archipelago with more than 300 islands, and today's blog post just examines two photos. If that maximum surge holds at around 10 ft (3 m), that would make this surge event comparable, or slightly lower, than the surge produced by Tropical Cyclone Oscar in 1983, on Beqa Island, Fiji (Terry 2007). Oscar produced a storm surge as high as 9.8 - 13.1 ft (3-4 m)

Browne and Krishna, staff at the Fiji Meteorological Service, wrote about Oscar's storm surge in a 1983 report published in Weather and Climate. Below is an image of their text about the storm surge and a map of Oscar's track relative to Fiji, which also comes from the report.


Oscar's storm surge is the highest credible storm surge level recorded in Fiji, according to the SURGEDAT global storm surge database (Needham et al. 2015). The New Zealand Herald reported a storm surge of 23 ft (7 m) from Tropical Cyclone Tomas, which struck Fiji in 2010, however, this report was not scientifically verified.

As we try to better assess the damage in Fiji, determining maximum water levels is important, because in many island regions of Oceania, saltwater overflowing islands can contaminate limited drinking water supplies and agricultural products. This is most pronounced on small, low-lying islands. Even relatively small storm surges can inflict long-term impacts if they contaminate food and water.

Here are some ways you can help with this assessment:

ACTION ITEMS:
1)    Do you know the location of either of the air photos shown in this blog? If so, please reply to this post or contact me at hal@marineweatherandclimate.com or hal.needham@galvestonhistory.org. We will have much better estimates of maximum water levels once we understand where this location was relative to the storm center.

2)    Do you have photos that show tree bark removal, or other evidence of high water marks, such as structures that have been washed away? If so, send to email above or post on Twitter with hashtag #Winstonhighwater.

Thanks, everyone. Obviously, our thoughts and prayers are with our friends in Fiji who are suffering through the aftermath of this powerful storm. Let's hope for a quick recovery.

-Hurricane Hal


REFERENCES:

Fritz, H.M., C. Blount, R. Sokoloski, J. Singleton, A. Fuggle, B.G. McAdoo, A. Moore, C. Grass, and B. Tate, 2008 : Hurricane Katrina Storm Surge Reconaissance. Journal of Geotechnical and Geoenvironmental Engineering, 134, 5, 644-656.

Needham, H.F., B.D. Keim, and D. Sathiaraj, 2015: A Review of Tropical Cyclone-Generated Storm Surges: Global Data Sources, Observations and Impacts. Reviews of Geophysics, 53 (2). 

Terry, J.P., 2007: Tropical Cyclones: Climatology and Impacts in the South Pacific. Published by Springer. 212 pp.    


Monday, February 1, 2016

The U-Surge Project Launches with Apalachicola, Florida

The U-Surge Project launches today, with a community storm surge page for Apalachicola, Florida. This project will provide site-specific storm surge history and analysis for at least 50 U.S. cities from Texas to Maine. Visit the U-Surge Project.


The Apalachicola dataset contains 35 historical storm surge observations since 1880. The highest recorded storm surges have both reached 10 ft (3.05 m) in the city. In 1903, an unnamed hurricane produced a 10-ft (3.05 m) storm tide, and in 1985, Hurricane Elena generated a 10-ft (3.05 m) storm surge. Visit the U-Surge Apalachicola Page.


A histogram of recorded storm surges shows how these two large flooding events stand out from others in recorded history. Each site will contain histogram and time series graphs that depict recorded storm surge for that community.


Check back next Monday, when I will launch a new city in the U-Surge Project.