Tuesday, March 28, 2017

Tropical Cyclone Debbie Pounds Queensland with Powerful Storm Surge

Tropical Cyclone Debbie made landfall along the Queensland coast Tuesday as a category-4 cyclone on the Australian cyclone wind scale. Debbie produced maximum sustained winds of around 175 km/ hr (110 mph), which would place it at the threshold of a category 3 hurricane in the Atlantic.

Debbie generated substantial coastal flooding for areas east and south of Bowen. Photographs coming from the impacted area have depicted storm surge and large waves pounding coastal buildings on Hamilton Island. 

Storm surge and waves pound a building on the coast of Hamilton Island, Queensland, on Tue Mar 28. Photo: http://www.abc.net.au/news/2017-03-28/cyclone-debbie-bom-before-after-hamilton-island-photos/8393164


Near Midge Point, photographs depict compound flooding from storm surge and heavy rain, without the presence of wave action. Witnesses on the ground have reported around 1 m (3.3 ft) of water above ground level, inundating buildings in the town. The region from Midge Point to Conway has a harbor that is open to the southeast, enabling prolonged winds to pile up storm surge in this region.

Compound storm surge and rainfall flooding in Midge Point, Queensland, on Tue Mar 28, 2017. Local reports indicated 1 m (3.3 ft) of water above ground level. Photo submitted by Jodi Lorraway of Proserpine.

Compound storm surge and rainfall flooding in Midge Point, Queensland, on Tue Mar 28, 2017. Local reports indicated 1 m (3.3 ft) of water above ground level. Photo submitted by Jodi Lorraway of Proserpine.

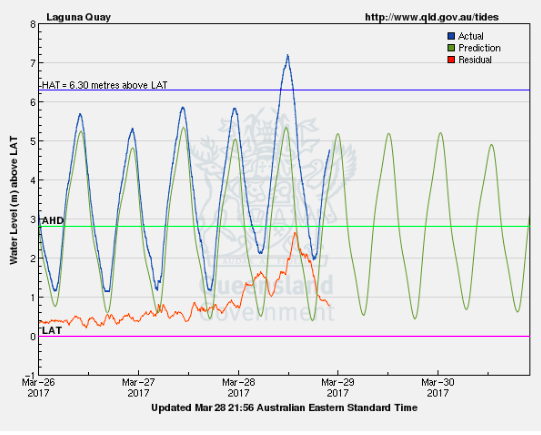
Storm surge levels exceeded 1 m (3.3 ft) above normal astronomical tides from Shute Harbour to Mackay. The highest recorded water level was 2.75 m (9 ft) at Laguna Quays, however, higher water marks may be found after the storm subsides and coastal surveys are conducted.

Storm surge levels exceeded 1 m (3.3 ft) from Shute Harbour to Mackay, with the highest recorded levels coming from Laguna Quays, where the storm surge reached around 2.75 m (9 ft). 

Unfortunately, the peak storm surge for many locations occurred near the time of high tide, enabling total water levels to exceed Highest Astronomical Tide (HAT). HAT represents the highest high tide under "normal" (non-storm) conditions, taking into account astronomical tide levels.

This was due, in part, to Debbie's slow forward speed, which enabled high water to persist for more than one day, ensuring high storm surge would occur near the time of high tide. Locals on the ground reported that one of the major differences between Debbie and Tropical Cyclone Ului, in 2010, was that Debbie's wind and storm surge lasted noticeably longer.

At Laguna Quays, the 2.75 m (9 ft) storm surge occurred near the time of high tide, enabling total water level (storm surge + tide) to exceed HAT  by around 80 cm (2.6 ft). 

Water level graph for Laguna Quays, Queensland. The orange line depicts storm surge (height above normal astronomical tide), while the blue line represents total water level, including tides. Source: https://www.qld.gov.au/environment/coasts-waterways/beach/storm-sites/laguna-quays/

Debbie generated the highest storm surge in Queensland since Tropical Cyclone Yasi produced a 5.33-m (17.5 ft) surge in 2011. According to the U-Surge Project, Debbie generated the 14th highest storm surge in Queensland since 1880, or a storm surge level that should only be expected approximately every 10 years in that state.

Tropical Cyclone Debbie generated a storm surge of 2.75 m (9 ft) at Laguna Quays, Queensland. This is the 14th highest recorded storm surge in Queensland since 1880.

Monday, March 27, 2017

Storm Surge Levels Rising along Queensland Coast

Tropical Cyclone Debbie Update
0230 AEST Tue Mar 28
1630 UTC Mon Mar 27

Storm surge starting to push in from Bowen to Dalrymple Bay. Storm surge at Laguna Quays has reached 1.2 m (3.94 ft) and surge levels at Bowen, Mackay and Dalrymple have all surpassed 0.5 m (1.64 ft).


The highest recorded storm surge level so far is the 1.2 m (3.94 ft) surge at Laguna Quays. This water level is tied for the 37th highest storm surge event in Queensland since 1880.


Although the storm surge is building in these areas, total water levels are falling because high tide has passed. The good news is that these locations made it through high tide without the water level surpassing Highest Astronomical Tide (HAT). This means that Debbie's water level did not exceed the "highest" high tides under normal (non-storm) conditions.


Storm surge levels were rising at Laguna Quays, QLD, after 2AM Tuesday morning, but total water levels were decreasing as the time of high tide had passed. Data source: https://www.qld.gov.au/environment/coasts-waterways/beach/storm-sites/laguna-quays/....annotations provided by Dr. Hal Needham.

The area of greatest concern is the north-facing coast east of Bowen. This area is observing lower-than-normal water levels as Debbie approaches, but as soon as the eye passes, intense winds from the north will quickly push a tsunami-like storm surge into this coastline. Anyone sheltering lower than 3 m (10 ft) above sea level in this area should beware.


Tropical Cyclone Debbie to Generate Large Storm Surge along Coast of Queensland, Australia

Tropical Cyclone Debbie was bearing down on the coast of Queensland, Australia, late Monday evening local time. As of 1300 AEST (0300 UTC) on Mon Mar 27, maximum sustained winds near the center of circulation were sustained at 150 km/ hr (93 mph), making it a category-3 on Australia's tropical cyclone category system. Debbie is forecast to make landfall near Bowen as a category-4 tropical cyclone around 0900 AEST on Tue Mar 28, however, conditions will deteriorate throughout Monday night between Bowen and Mackay.


This map from the Australia Bureau of Meteorology depicts destructive winds from TC Debbie coming ashore near Airlie Beach as of 10PM local time (1200 UTC) on Mon Mar 27.

Storm surge levels were beginning to build on Monday afternoon at several sites along the Queensland coast. Laguna Quays, Mackay and Dalrymple Bay all reported storm surge levels exceeding 0.5 m (1.64 ft).  Water levels should increase through the night as TC Debbie approaches the coastline, with storm surge exceeding 2.5 m (8.2 ft) in localized areas between Bowen and Mackay.


Storm surge levels exceeded 0.5 m (1.64 ft) at Laguna Quays on the Queensland coast late Monday evening, as TC Debbie approached the coastline.

Most locations in this part of the world have a high tidal range, with the difference between high and low tide often exceeding 4 m (13.1 ft). Such large tidal ranges will affect the timing of maximum coastal flooding on the landscape. While storm surge refers to the difference between predicted (astronomical) tides and actual water levels, storm tides combine storm surge with astronomical tides to produce a total water level that is seen on the landscape.

Most areas will experience the greatest coastal flood impact within two hours of high tide, however, storm tide flooding is quite localized, and a difference of several kilometers can make substantial difference in water levels. The table below provides generalized information on tidal ranges and the timing of the greatest flood impact for selected locations.


Waves and storm surge were building along the Queensland coast on Monday morning (local time). This pic shows conditions near Mackay. Image: @meljmaddison on Twitter.


Location                    Tidal Range                Time of Greatest Coastal Flood Impact
Dalrymple Bay        5m+ (16.4ft+)               10PM Mon - 2AM Tue
Mackay                    5m+ (16.4ft+)               10PM Mon - 2AM Tue
Laguna Quays         4m+ (13.1ft+)                10PM Mon - 2AM Tue
Shute Harbour         3m+ (9.84ft+)                10PM Mon - 2AM Tue
Bowen                     2.5m+ (8.2ft+)              10PM Mon - 2AM Tue       
                                                                                 8-10AM Tue

Much of the coast will experience the greatest coastal flood impact between 10PM Mon and 2AM Tue, local time, corresponding with the hours near high tide. However, some areas near or just south of Bowen, could experience a secondary high water event later Tue morning near the time of landfall.

There should be a drastic difference in water levels and timing of high water between north- and south-facing coasts...

South-facing coasts, in areas such as Conway:
Water levels will gradually build as Debbie approaches, reaching maximum levels just before Debbie makes closest approach...

North-facing coats, such as Airlie Beach
Water levels may actually be lower than normal as Debbie approaches due to strong south winds. Just after closest approach, winds will suddenly blow from the north and could rapidly generate storm surge....flooding could come in as we typically think of a tsunami...almost in one sudden wave.

Fortunately, the coast of Queensland has been on high alert and flood/ evacuation maps have circulated through many communities. For example, Townsville City Council circulated a map depicting the most areas most vulnerable to storm surge flooding to help people make evacuation decisions.

Townsville City Council map depicting areas most vulnerable to coastal flooding. The Townsville Bulletin circulated this map to help people make potential evacuation decisions.

The U-Surge Project has identified storm surge levels for 72 tropical cyclones that have struck Queensland since 1880, providing an updated database that builds off the foundational work from Needham et al. (2015). A storm surge level of at least 2.5 m (8.2 ft) would tie Debbie for 15th place since 1880, according to Queensland storm surge records. This would make Debbie's storm surge around a 9-year flood event, or a flood level we should expect on average around every nine years.

As of early Monday afternoon, TC Debbie's high water mark of 0.85 m (2.62 ft) ties it for 50th place all-time since 1880. This blog will be updated frequently through the storm, enabling you to follow Debbie's peak surge level and see how high it ranks in historical context. 


Needham et al. (2015) provided a data-driven frequency analysis of storm surges in Queensland, finding that this region observes an average of 2.5 storm surges per decade exceeding 2 m (6.56 ft) and an average of 1.4 storm surges per decade exceeding 3 m (9.84 ft).

Tropical Cyclone Yasi was the last cyclone to generate a storm surge exceeding 2 m (6.56 ft) in Queensland. This cyclone generated a storm surge of 5 m (16.4 ft) near Cardwell in 2011.