Friday, November 22, 2013

"We were ready for the wind. We were not ready for the water."

Several articles have recently discussed the need for storm surge education, following Super Typhoon Haiyan's destructive storm surge in the Philippines. I've provided links to two articles below.

Lean Santos of Devex provides interesting insight into the challenges of communicating storm surge predictions to coastal populations in article #1 below.

Christopher Bodeen provides insights into the mindset of locals as this event unfolded, as well as some fascinating insights into evacuation options for people who live in a nation of many islands. See article #2 below.

He also provided a quote that may best summarize the need for education. He quotes senior presidential aide Rene Alemendras, who said, "I was talking to the people of Tacloban....They said 'we were ready for the wind. We were not ready for the water.'


Link #1:
https://www.devex.com/en/news/storm-surge-lost-in-translation-and-interpretation/82311?mkt_tok=3RkMMJWWfF9wsRonvaTAcu%2FhmjTEU5z16O8kUaSwhIkz2EFye%2BLIHETpodcMRcVkNq%2BTFAwTG5toziV8R7bNKc1r2NkQXBfn

Link #2:
http://www.startribune.com/politics/national/231415691.html


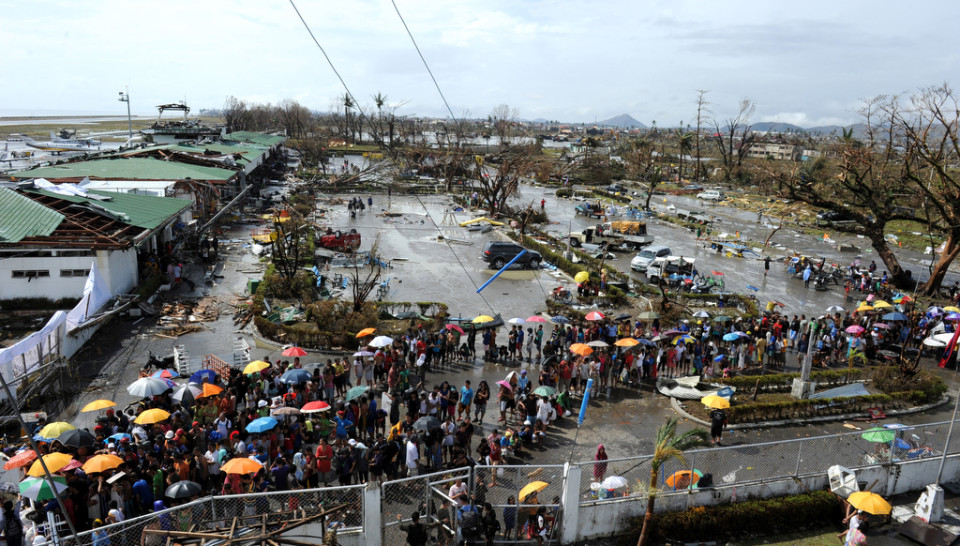
 Many people in the Philippines were not prepared for Haiyan's massive storm surge. The coastline of the Philippines contains many gulfs, bays and inlets, which create localized surge heights, making education efforts challenging in this region. Image: Associated Press


Many people have been asking me how it is possible that the people of the Philippines were not ready for this storm surge event, when they experience so many typhoons (hurricanes). Although such issues are complex, involving many physical and societal variables, we must remember a few things about this surge event and storm surge in the Philippines.

1. The magnitude of this catastrophe was truly extraordinary.

As explained on previous blog posts, it is thought that Haiyan produced stronger wind speeds at landfall than any tropical cyclone in world history. Also, the surge height appears to have exceeded 6 meters, which would place it close to the 7.3-meter storm surge of 1897 on Samar, Philippines. The 1897 event was the largest surge level in the modern history of East Asia.

2. Storm surge inundation in the Philippines tends to be very localized.

The coastal shape of the Philippines contains many gulfs, bays and inlets, as the Philippines are really comprised of numerous large and small islands. Storm surge tends to pile up in bays and inlets that are exposed to strong onshore winds. However, the area of the highest storm surge is often quite localized, and dependent upon the track of the storm.

Therefore, many typhoons may impact a given location over a period of several decades, but perhaps only one typhoon will generate a massive storm surge at that place, because the track needs to be just right to pile up surge along the coast. Such localized effects make storm surge education very difficult, because slight changes in storm tracks over the Philippines will often produce vast differences in coastal flooding patterns.


Hurricane Ike generated a widespread surge along the U.S. Gulf Coast in 2008. Much of Texas and South Louisiana would have been flooded even if Ike's track slightly shifted, because most of the coast is open and exposed to storm surge. In contrast, the coastal shape along the islands of the Philippines create very localized surge heights. Image: SCIPP/ SURGEDAT (Hal Needham).


In general, broader bodies of water with less islands tend to have less localized surge events, making education somewhat easier, because surges tend to be widespread. Take South Louisiana, for example. Most of the coastline is flat and exposed to the Gulf of Mexico. In 2008, Hurricane Ike made landfall in Texas, but generated a massive surge along the Louisiana Coast. However, if the track of Ike changed by 100 km (62 miles), most of South Louisiana would have still experienced a massive storm surge. In contrast, if Typhoon Haiyan's track had changed by 100 km, it is likely that the surge pattern would have been quite different, because the intricate shapes of the islands help generate different surge heights when the storm track changes.

The localized nature of surge in the Philippines may help explain why many people were taken off guard. Such people may be surprised to find out that future tropical cyclones with slightly different tracks may produce very different storm surge levels in hard-hit areas like Tacloban. Education efforts may help people to realize the causes of storm surge, as well as localized patterns in their region.

Friday, November 15, 2013

Super Typhoon Haiyan Storm Surge Animation


 Check out this storm surge animation for Super Typhoon Haiyan, provided by Deltares.

https://www.youtube.com/watch?v=8SH5fhGYCm0


Deltares link: www.deltares.nl/en

https://www.youtube.com/watch?v=8SH5fhGYCm0
 Deltares created a storm surge animation that shows computed surge levels for Super Typhoon Haiyan, which generated a devastating storm surge in the Philippines last week.


In personal correspondence with Jeff Masters of Weather Underground, Jeff told me that these surge levels were computed using Delft3D two days after landfall. The wind fields are based on JTWC data.

Thanks, Jeff, for passing this on, and great work by Deltares to model this event so quickly!

Haiyan Storm Surge Estimates Improve through Shared Observations


Estimates on Super Typhoon Haiyan’s massive storm surge height have improved through shared field observations and online collaboration.

Yesterday, I posted some photos sent to me by Aslak Grinsted, from the Niels Bohr Institute in Copenhagen, Denmark. Aslak had sent me photographs, which clearly showed the height of tree bark removal on trees in the surge impact zone.

How high was Super Typhoon Haiyan's destructive storm surge? Field observations and online collaboration are starting to provide some early estimates. Image: AP Photo/ Philippines Air Force

Just a few hours later, I received the following email from Vinny Burgoo, who was familiar with the area, knew the locations of the photos, and had some insight into the ground elevation.

Here is the e-mail:

Hi, Hal!

I've just read your blog about Aslak Grinsted's surge estimates for Typhoon Haiyan. Image #1 shows the southern end of the car park for Daniel Z. Romualdez Airport outside Tacloban City. Image #2 shows a queue at its northern end. See...


...(and the pix at Skyscraper City, below). Image #1's generators and the red collapsed slide or whatever it was are visible at the far end. Image #2's crumpled corrugated iron is visible in the foreground.

Image #3 is looking west across the northern end of the car park - and it *is* the same tree as in Image #2.

Elevation? The runway is said to be 3.0 m above MSL. An engineer's plan says a point just north of the terminal is '2.253' - presumably m above MSL. The plan is near the end of this page:


More pix of the post-typhoon airport are at the end of that thread.

Hope this helps a bit.

Regards,

Vinny Burgoo

Vinny mentioned that all three photographs were taken from the airport area. Image #1 on yesterday’s blog post was from the southern end of the carpark, while images 2 and 3 were taken from the northern end of the carpark.

The last link provides an architectural plan for proposed airport construction. Points on the map, accompanied by numbers, apparently show elevation levels. The map is oriented so right of the map is facing north.

This architectural map of the Tacloban Airport reveals elevation markers of 2.253 m (7.39 ft) very close to the location of the photographs sent in from Aslak Grinsted. Ground elevation values are essential for estimating surge heights when using high water marks or tree bark removal. Image: http://www.skyscrapercity.com/showthread.php?t=591415&page=78; Photo markups: Hal Needham

Three points on the map just south of the carpark are given an elevation of 2.253 m (7.39 ft), including the roundabout that is adjacent to the south end of the parking lot. This elevation seems like a reasonable estimate for the ground level in the photos, however, additional elevation information from multiple sources would be helpful for verification.

In image #2, Aslak estimated the surge height as 2 human heights, and in image #3, he estimated 2.5-3 human heights. According to Vinny, this is the same tree, located near the north end of the carpark. It goes without saying that it is difficult to make such estimates from photos taken at a distance, and Aslak did a great job by finding a few photographs with people in the picture to provide scale.

Locations of the photographs from Aslak Grinsted, posted on yesterday's blog. Vinny Burgoo identified the locations of all three photos, placing them at different ends of the airport carpark. Image: Google; Photo Markups: Hal Needham

If we assume the height of the tree bark removal reaches to 2.5 human heights, and we assume that the average adult human height in the photograph is approximately 1.7 m (5 feet 7 inches), then we receive an approximate elevation of 4.25 m (13.94 ft) for the height of tree bark removal above ground level.

However, the surge was higher than this level, because it took a certain amount of storm surge for the water to rise from Mean Sea Level (MSL) to ground level. Thus, we should add the ground elevation to our height. Adding 2.25 m (7.38 ft) to the water height gives us 6.5 m (21.33 ft), which we may use as a rough estimate of the surge height in this area.

Josh Morgerman submitted an Icyclone Chase Report to document the observations that he took alongside James Reynolds and Mark Thomas, from the Hotel Alejandro, in the heart of Tacloban City’s downtown district. The team was able to provide a storm surge observation, as the hotel they were staying in was inundated with water.

Quote from report:
“The storm surge rose very suddenly and rapidly, and it peaked near or after the center’s closest approach. The hotel flooded to a depth of ~4 ft. If the elevation at this location is truly 26 ft- as indicated by USGS- that suggests a storm surge of up to ~30 ft. It’s possible the elevation may have been as low as 15 ft, in which case, the surge was ~20 ft.”

The Icyclone Chase Team took storm observations from the Hotel Alejandro, in the heart of downtown Tacloban, about 15 nm north of the landfall location. Source: Icyclone Chase Report- Preliminary 

If the surge did indeed reach 30 feet (9.144 m) in downtown Tacloban, that water height would have been extraordinary, and would have smashed the previous surge record of 7.3 m (23.95 ft) for the Philippines and all of East Asia. The good news here is that we have a water height measurement from a fixed location, where the structure survived the storm. It will just take some time to verify the elevation of this hotel, in order to increase the confidence of this measurement. Google Earth provides an elevation of 7.32 m (24 feet) for the area near this hotel, which would provide a surge level of 28 feet (8.53 m). The Icyclone Chase Report does mention the possibility that the surge level could have been as low as 6.1 m (20 feet) in their location.

Early surge estimates are 6.5 m (21.33 ft) at the airport and 8.53-9.14 m (28-30 ft) in downtown Tacloban. Elevation estimates for the downtown observation is uncertain, the surge height in that location may be as low as 6.1 m (20 ft). Image: Google; Photo Markups: Hal Needham

Storm surge data often are provided from different sources with different measuring techniques. In this case, some observations are starting to come in, however, there is still quite a bit of uncertainty with these observations, and the values at this point are only rough estimates. It will be very helpful to verify the elevation of Hotel Alejandro, and any other high watermarks from buildings in the area that survived the storm. 


The surge estimate at the airport appears to have more accurate ground elevation information, however, the height of the tree bark removal depends on human height as a comparison. Meanwhile, the downtown observation has a more accurate read on the water level in the structure, however, the elevation at that location is more uncertain.

Commonly, when reconstructing a storm surge inundation, various observations have their strengths and weaknesses regarding accuracy of measurement. At this point, these surge estimates are very preliminary and are beginning to paint a picture of a surge that inundated this region with perhaps a 7.5 meter (24.6 foot) surge- give or take approximately several feet (one meter).

Estimates will improve as more information becomes available. Thanks so much to all who contributed by doing fieldwork, sending photos, or helping with photo interpretation. 


Thursday, November 14, 2013

Researcher Estimates Philippines Storm Surge Height from Denmark


After a major coastal flooding event, we want to know the maximum water height in various locations. Such information helps us better understand the process that triggered the event, and also helps us learn about localized flooding patterns.

Post-storm field surveys generally rely on trained field teams to go into an area and measure high-water marks. Such teams are generally looking for various clues that indicate the maximum water height. Signs on the landscape include the height of rafted debris, damage trimlines, tree bark removal, as well as mudlines or waterlines inside or outside standing structures.

Massive storm surges are so catastrophic that they destroy tide gauges as well as most buildings, making it difficult to obtain high water marks. After such disasters, measuring the height of tree bark removal is sometimes the best way to estimate surge heights. Photo: Noel Celis/ AFP/ Getty Images

A researcher from Denmark has already begun analyzing photographs for evidence of high-water marks, following Super Typhoon Haiyan’s massive storm surge in the Philippines. Aslak Grinsted, assistant professor at the Centre for Ice and Climate, at the Niels Bohr Institute, in Copenhangen, Denmark, has estimated the height of tree bark removal in numerous photographs from the impacted area. Such analysis is very valuable, because it provides some of the earliest estimates of surge height in the region.

Aslak Grinsted, assistant professor at the Centre for Ice and Climate, at the Niels Bohr Institute, has begun estimating  Haiyan's storm surge level by analyzing the height of tree bark removal in photos

Aslak sent me several photos earlier this week. Note the utter devastation in these photographs, as well as the fact that few structures remain standing to provide water lines or mudlines. In such massive surges, the height of tree bark removal often provides the best estimate of water levels, as debris floating on the top of the water column during the surge event rubbed off the tree bark.

Image #1 from Aslak Grinsted


Image #2 from Aslak Grinsted


Image #3 from Aslak Grinsted


Aslak compared the height of tree bark removal to the height of people in some of the photographs. In one photo, he estimated the height of tree bark removal to be approximately 2 human heights, while he estimated a water level of 2.5-3 human heights in another photo. If we assume the average human height in this area to be approximately 1.7 m (5 feet 7 inches), these approximations would provide estimates of surge levels reaching 3.4 m (11.2 ft) and 4.25-5.10 m (13.9-16.7 ft).

In order to accurately estimate the storm surge height, it is necessary to know the ground elevation for each observation, because storm surge is measured as the water height above the predicted tide level. Field teams will eventually provide accurate measurements, but in the meantime, online crowdsourcing may provide the best method for early surge estimates.

Here are some questions you could help with:


  •  In the photos that Aslak used to identify tree-bark removal, does anyone know the name of the location and/or the approximate ground elevation?

  •   Have you seen any photographs that contain clear signs of tree bark removal, rafted debris, mud lines, water lines, or damage trimlines on buildings/ structures?


If so, please send photos to Hal Needham at the following email: hal”at”srcc.lsu.edu. Please make sure to provide a citation and weblink for any photographs, if possible.

Aslak’s initial work this week has shown us the potential for all of us to participate in post-disaster field work, even from across the globe. As our world becomes more connected, opportunities should continue to open up for increased collaboration after such catastrophes.

Tuesday, November 12, 2013

Sudden Shift in Wind Direction Caused Wall of Water to Slam into Tacloban, Philippines


A massive storm surge, described by many as a wall of water, slammed the Philippines as Super Typhoon Haiyan came ashore last week. The powerful surge deposited large ships in neighborhoods.
Image: Noel Celis/ AFP/ Getty Images

A sudden shift in the wind direction caused a wall of sea water to crash into Philippine city of Tacloban last Friday. This wall of water obliterated entire neighborhoods, and may have killed thousands of people.

At a given location, intense cyclonic winds may quickly change direction because winds in tropical cyclones spiral around the placid eye. The most intense winds are generally found in the eye wall, a ring of intense wind and storms that surrounds the eye of a cyclone.

As Tropical Cyclone Haiyan approached the city of Tacloban, very strong winds blew from the north across San Pedro and San Pablo Bay, the body of water on which Tacloban is located. Intense winds from this direction would have tempered or even reduced water levels in the Bay. The satellite image below depicts the storm location relative to Tacloban as the eye approached the city from the east.


Intense northerly winds tempered the surge levels near the city of Tacloban when Super Typhoon Haiyan was centered to the east of the city.
Satellite Image: CIMSS/ SSEC/ Univ of Wisconsin- Madison


However, as the center of the cyclone tracked from east to west, passing south of the city, the wind direction near Tacloban shifted, and the most intense tropical cyclone winds ever felt on land pushed a massive wall of water towards the city. The satellite image below, taken just one hour after the first image, shows the storm’s position at this time. Interpretation of these images reveals that the shift in winds, and the sudden surge of waters, happened extremely fast, as the winds continued to blow from the north near Tacloban for some time after the first image was taken.

As Haiyan's center of circulation moved west, the winds near Tacloban suddenly shifted to the southeast. This rapid shift in wind direction caused a wall of water to blow into the city. This image was taken only one hour after the first image.
Satellite Image: CIMSS/ SSEC/ Univ of Wisconsin- Madison


The sudden shift in winds caused a massive wall of water to slam into the north end of the Bay, including the city of Tacloban. Although storm surge is often described as a dome of high water, eyewitnesses described this surge as a wall of water that washed away everything in its path.

The ingredients that led to this quick-moving wall of water were also present during the 1900 Galveston Hurricane, which killed between 6,000 and 8,000 people (Rappaport and Fernandez-Partagas 1995) in the deadliest natural disaster in U.S. history.  As the hurricane approached Galveston, intense winds were blowing offshore, which helped temper the height of the storm surge. However, as the eye of the storm approached the city, the wind direction shifted and the water rose very rapidly.

A sudden shift in wind direction enabled a 6.1 m (20 ft) surge to rapidly move into Galveston, Texas, in the most deadly natural disaster in U.S. history.

Isaac Cline, the Chief Meteorologist at Galveston, witnessed this rapid water rise first hand, while standing in his home. Although he did not describe the surge as a wall of water, he estimated the water rose four feet (1.22 m) in four seconds. The surge continued to rise, reaching a height of 6.1 meters (20 feet) (Garriott 1900).

Quote from Isaac Cline:
The water rose at a steady rate from 3 p.m. until about 7:30 p.m., when there was a sudden rise of about four feet in as many seconds. I was standing at my front door, which was partly open, watching the water, which was flowing with great rapidity from east to west. The water at this time was about eight inches deep in my residence, and the sudden rise of 4 feet brought it above my waist before I could change my position.

(National Oceanic and Atmospheric Administration 2004).

 Isaac Cline, the Chief Meteorologist at Galveston, Texas, observed a four foot (1.22 m) rise in water level in four seconds during the 1900 Galveston Hurricane.
Image: http://www.awesomestories.com/assets/isaac-cline1

Although there are many differences between the Galveston Hurricane of 1900 and Super Typhoon Haiyan, the shift in wind direction, rapid water rise, and massive amount of fatalities are similar. Such comparisons reveal the value of shared knowledge regarding storm surge inundations, which have emerged as one of the world’s foremost hazards.

Researchers with the Southern Climate Impact Planning Program (SCIPP) at Louisiana State University and the University of Oklahoma have partnered to build a global storm surge database that enables such comparisons. The database, called SURGEDAT, has archived the location and height of peak storm surge for more than 650 global surge events since 1880. The database can be found on the web at: http://surge.srcc.lsu.edu.

Although SURGEDAT has archived 113 surge events in East Asia, data from the Philippines and other countries are still being built and will be uploaded to the website this winter. For the most recent surge data, please contact Hal Needham by email at the following address: hal"at"srcc.lsu.edu.


 SURGEDAT has identified the location and height of peak storm surge for more than 650 tropical cyclones around the world since 1880. Recent work from East Asia, including the Philippines, will be uploaded this winter. Link: http://surge.srcc.lsu.edu.


References

Garriott, E.B., 1900: West Indian hurricane of September 1-12, 1900. Monthly Weather Review, 28, 371-378.

National Oceanic and Atmospheric Administration, 2004: NOAA History, A Science Odyssey. Galveston Storm of 1900. Available on the Web at: http://www.history.noaa.gov/stories_tales/cline2.html.

Rappaport, E.N, and J. Fernandez-Partagas, 1995: The deadliest Atlantic tropical cyclones, 1492-1994. NOAA Technical Memorandum NWS NHC-47, National Hurricane Center, Pgs. 1-41.