Monday, January 25, 2016

An Overview of the Jersey Shore Flood


What happened?
A powerful nor’easter pushed a substantial storm surge into coastal communities along the Jersey Shore over the weekend. Footage of ice-choked water flowing into locations like Sea Isle City, Ocean City, and West Wildwood, New Jersey, surfaced on Saturday morning.

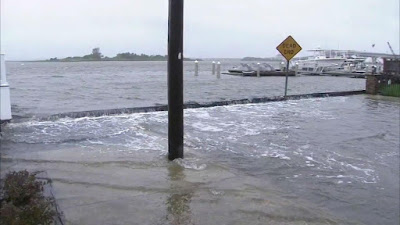
Ice-choked water quickly flowed into North Wildwood on Saturday morning. Image: AP


Was this worse than Sandy?
In terms of total impact, Superstorm Sandy inflicted much more damage along the New Jersey Coast. However, a few locations actually observed higher total water levels this past weekend than during Sandy.

The difference between the storms is that Sandy generated a higher storm surge, which is the amount of water actually pushed in by the storm. Sandy’s surge was high enough to push a massive amount of water and destructive waves over the beaches and dunes. The storm surge this past weekend was not as high, and beach replenishment projects proved their worth as they kept back sea water in most locations.

Superstorm Sandy's massive storm surge and powerful waves slammed the Jersey Shore with an all-out blitz from the sea. The surge and waves overwhelmed coastal dunes and other flood defenses. Image: http://www.zmescience.com/research/studies/hurricane-surges-worsen-future-climate-change-042342/.


However, storm surge of 3-4 ft (0.91 – 1.22m) arrived in time for Saturday morning’s high tide, which was close to the highest predicted tide level for the month. This enabled localized flooding to eclipse Sandy’s level in some locations, especially where water pushed in from the back bays.

Perhaps the biggest take home message from this weekend's flooding is that every storm is different. While this recent flood was not as bad as Sandy from a broad perspective, water levels surpassed Sandy's in some locations, and some homes that did not flood in Sandy flooded this past weekend.

Back bay flooding was common in places like Ocean City, New Jersey, where water levels surpassed that of seawalls. Image: http://abc7ny.com/weather/photos-flooding-at-the-jersey-shore/1013740/.


Why did the water come in so quickly?
Videos from locations like Sea Isle City and West Wildwood, New Jersey, showed storm surge waters flowing through the streets like a river. Why did the water come in so quickly?

One reason is that the storm surge hit near the time of full moon, which is the time of highest monthly tidal levels.  More accurately, tides near the time of full moon oscillate the most, so high tide tends to be higher and low tide tends to be lower. This means that water is moving in and out more quickly between tidal cycles. On Saturday morning water rushed in from the storm surge and approaching high tide at the same time, causing total water level rises of more than six feet in a few hours in some locations.


Water rescues became commonplace along the Jersey Shore on Saturday, as storm surge quickly rushed in from back bays. Image: AP.

The failure of flood control devices is another reason water can suddenly rush into a community. According to the NBC Nightly News, a flood control structure failed in West Wildwood, New Jersey, which led to a push of sea water into the community.


Is this climate change?
The Mid-Atlantic Coast has experienced substantial coastal floods over the past five years. Hurricanes Irene in 2011 and Sandy in 2012 generated widespread coastal flooding (Irene wasn't as bad in S. Jersey), and extra-tropical systems have flooded the region outside of hurricane season. An intense nor’easter flooded the region this past weekend in areas that flooded just last October from a prolonged onshore wind.

The high frequency of these flood events may feel very much like climate change. However, it’s important that we step back and make sure our perspectives are scientifically sound before we slap a climate change label on what appears like a certain pattern.

Hurricane Sandy inundated coastal New Jersey and New York with a massive storm surge in 2012. Was this a random event or part of a larger climate change signal? Image: http://wqad.com/2012/10/29/photos-from-hurricane-sandy/

Sea level rise is an important component of these floods, and that is a clear signature of climate change. For most of the U.S. coastline, sea-level rise is a persistent, long-term threat, with surprisingly pernicious impacts. In coastal New Jersey the rate of relative sea level rise is around 1.0 -1.5 ft per century. The graph below shows a rate of 1.34 ft per 100 years at Atlantic City. Although this rate may not sound substantial, the impacts of sea level rise are profound.

Even a few inches of sea level rise can lead to increased beach erosion, additional stress on sea walls and coastal flood defenses, and exacerbate flooding when accompanied by heavy rain. Rainfall runoff in most places is gravity-fed, requiring a slope to drain. Increased sea levels decrease this slope, slow the drainage, and exacerbate flooding, slightly inland and right at the coast.

The long-term sea level trend in Atlantic City depicts an average rise of 1.34 ft (0.41 m) per 100 years.
Source: NOAA Tides and Currents.

A detailed, scientifically sound study needs to be conducted to determine if the recent onslaught of strong storms in this region is random or part of a larger climate change trend. Climate change leads to changes in atmospheric and oceanic patterns, which can cause a lot more havoc than just warming the temperature of our backyard thermometer a few degrees. That said, clustering of storms is not uncommon. Dr. James Elsner of Florida State University has related this to hurricanes, saying that, "Florida tends to get hit in clusters."

Here are some examples of storm clustering, which later was followed by a long, quiet period:

1) In the 1880s and 1890s, South Carolina and Georgia were pounded by many intense hurricanes, but the region, especially Georgia, has been relatively quiet since 1900 (Hurricane Hugo slammed SC in 1989).

2) Tampa, Florida, observed two powerful hurricanes in 1848, producing two of the three highest recorded water levels within the same month. Surge levels reached 14 ft and 10 ft just a few weeks from each other. Since then, storm surge has not reached those levels, except for a 10.5 ft surge in 1921.

3) Between 1961 and 1980, South Texas experience many intense hurricanes with massive storm surges. These storms included Carla (1961), Beulah (1967), Celia (1970) and Allen (1980). The area has been relatively quiet since 1980, the last year that Corpus Christi observed a storm surge of at least 4 ft.


Hurricane Allen pounded the South Texas Coast with a massive storm surge and powerful waves in 1980. This flood event was part of a 20-year period of powerful storm surges in this region, but coastal floods in this area have had minor impacts since then. Image: http://maroonedinmarin.blogspot.com/2007/08/global-warming-being-blamed-for.html.

4) During the hurricane seasons of 2004-2005, seven hurricanes struck Florida. However, Hurricane Wilma (2005) was the last hurricane to strike the peninsula, as Florida has now experienced more than 10 years without a hurricane strike.

This topic of separating random variability from a long-term climate change trend warrants future research, as extreme weather events are costly and the science behind them is complex.

Saturday, January 23, 2016

Substantial Back Bay Flooding in New Jersey and Delaware

Substantial back bay flooding is inundating New Jersey and Delaware this morning. Tides in back bays usually peak after tides on the open coast, so bay levels peaked in many places during the past two hours.

Here are some pics from Atlantic City, Wildwood, North Wildwood and Sea Isle City, New Jersey.


Location: New Hampshire and Atlantic in Atlantic City, NJ
Source: @JitneyGuy (Twitter)


Location: North Wildwood, NJ
Source: @acpressgerhard (Twitter)


Location: JFK in Sea Isle City, NJ
Source: @SeaIsleChamber (Twitter)


Location: West Wildwood, NJ
Source: @jesslynmil (Twitter)

The Weather Channel reported that the total water level (storm surge + tide) exceeded the level produced by Superstorm Sandy in Stone Harbor, New Jersey. If areas have indeed exceeded Sandy's water level that is due to the unfortunate timing of this event. Although Sandy generated a higher storm surge (water displaced by the storm), strong winds today enabled the surge to rush in just before today's highest high tide, which is near the highest tide level for the month because of tomorrow's full moon.

The timing of today's moderate storm surge and extremely high tide may have enabled the total water level to eclipse Sandy's highest water in several locations.


Coastal Flooding Webcams for the Mid-Atlantic Coast

Here are some webcams that let us watch storm surge/ coastal flooding along the Mid-Atlantic Coast:

Location: Margate Fishing Pier, Margate, New Jersey
Source: http://www.listingcam.com/webcam/margate-fishing-pier-webcam/

This cam provides a great look at powerful waves striking the pier, which is on the ocean side of the island.


Cam: Bethany Beach Boardwalk Cam - Bethany Beach, Delaware
Link: http://www.visitdebeaches.com/bethany-beach-boardwalk-cam-north-view

This cam shows a streaming view of high surf reaching to the dunes. The ocean at this location looks about 100 feet from the buildings, which would surely flood if not for the dunes.


Location: Gardners Basin, New Jersey
Source: http://www.listingcam.com/webcam/gardners-basin-wide-live-view-webcam/

This cam shows a live shop at the top of screen. But scroll down! You'll see a sweet time lapse from the past 24 hours or so. The docks float so they go up and down with the water, but look at the water level compared to the ropes/ straps on the pilings, which are fixed. We can really see some nice water level rise!


Cam: The Cove in Cape May, New Jersey (Light House Views)

Webcam provides view down the coast, but moves to give us different views. We can see Cape May Lighthouse on South View. When camera zooms out on east or southeast view, we see a sand entrapment fence, which is close to high water line this morning. View to northeast shows waves crashing on dunes.


Cam: Wet and Wild - Northstar and Sunset Cam - Ocean City, New Jersey
Link1: http://igv.com/?cam=wetandwild555

The dock on the left and the pilings appear to be stationary, allowing us to watch water rise against them. The dock on the right appears to be floating, and will rise with the elevating water.


Cam: Wet and Wild - Speed Boat and Bridge- Ocean City, New Jersey

Floating dock with nice zoomed in cam to see waves splashing against dock and piling.


Cam: Wet and Wild - Jet Skis and Boat Docks- Ocean City, New Jersey

Floating docks with pilings.


Substantial Coastal Flooding Underway along Mid-Atlantic Coast

Winter Storm Jonas is developing a deepening low pressure center off the Mid-Atlantic Coast this morning. Strong onshore winds have arrived earlier than originally forecast, enabling the storm to already generate a storm surge exceeding 3 ft (0.91m) in some areas. This is bad timing because this storm surge has arrived before the highest high tide of the day, which will occur over the next 2-3 hours in most locations.

Webcams in Atlantic City depict heavy snow, strong winds, and storm surge rapidly moving onshore as high tide approaches.

Here is a tabular update of what is happening, according to NOAA Tides and Currents:

LOCATION           DATE      TIME       SURGE   TOTAL WATER(TW)    FORECAST TW
Chesapeake, VA    Jan 23       5:24AM    3.42 ft     5.47 ft above MLLW      ~6.7 ft @ 7:30AM

Cape May, NJ       Jan 23       5:24AM    2.40 ft     6.14 ft above MLLW      ~8.4 ft @ 7:42AM

Atlantic City, NJ  Jan 23       5:24 AM    2.90 ft     7.19 ft above MLLW     ~7.9 ft @ 6:36AM


The Jersey Shore is already observing storm surge levels approaching 3 ft (0.91 m) above normal, as the highest high tide of the day approaches. Image: www.tidesandcurrents.noaa.gov.


My biggest concern is the rapid water level rise along the Jersey Shore, in places like Atlantic City. The highest high tide of the day, and one of the highest high tides of the month, will occur in the next hour at Atlantic City, which would have already created a high water event even if there was no storm. Much of the Jersey Shore will experience substantial coastal flooding today, particularly around the times of high tides.

Thursday, January 21, 2016

Winter Storm Jonas Threatens to Slam Mid-Atlantic Coast with Coastal Flooding and High Waves

Winter Storm Jonas threatens to slam the Mid-Atlantic Coast with storm surge and high waves. While this epic winter storm will most be remembered for inflicting blizzard conditions near the Nation's Capital and dumping feet of snow, coastal flooding is a concern from Virginia through New Jersey.

I've begun to hear chatter about this coastal flood event being one for the record books. In this blog post, I share details about the upcoming flood event in terms of timing and magnitude. I conclude that while this will not be a storm surge for the record books, total water levels may be similar this past October's surge event, with potentially greater impacts.


Wind Event
The National Weather Service is forecasting a strong onshore wind event for tidewater Virginia, the Delmarva Peninsula, and the Jersey Shore. The grid point forecast for Cape May, New Jersey, depicts sustained winds exceeding 40 mph, with gusts in the 50s mph, for an 10-hour period on Saturday.

The GFS Model predicts a 993-mb surface low will pull off the Atlantic Coast on Saturday afternoon. The pressure gradient will generate strong onshore winds from Virginia to New Jersey. Image: http://www.tropicaltidbits.com/


Wind Direction
The most intense winds will be from an ideal direction to cause coastal flooding. Strong northeast winds are the most efficient at generating coastal flooding along the Delmarva Peninsula and coastal New Jersey, because water tends to deflect to the "right" of winds in the Northern Hemisphere.


The National Weather Service forecasts maximum sustained winds to exceed 40 mph and wind gusts to exceed 50 mph for a 10-hour period on Sat Jan 23, at Cape May, New Jersey. The red box on this graphic depicts wind speeds from 10AM - 6PM on Saturday in Cape May. The strongest winds should be from the northeast. Source: www.nws.noaa.gov.


Timing
The strong winds will build the biggest surge through Saturday afternoon and evening, which is unfortunate timing on the monthly calendar. The moon is full on Sunday, meaning high tides this weekend will be at their highest levels for this month.


Unfortunately, this weekend's storm coincides closely with a full moon, which creates the highest tide levels of the month.

However, on the daily calendar, the timing of the most intense winds is actually quite good. This region experiences two high tides per day, and it appears the storm will displace more water around the time of "Lower High Tide," on Saturday evening, than the "Higher High Tides" on Saturday and Sunday mornings. This is fortunate, as coastal flooding would be worse if the strongest winds arrived earlier or later.


Water Levels
We can expect maximum storm surge levels to reach approximately 3.0-3.5 ft above predicted astronomical tides on Saturday afternoon and evening in the most vulnerable areas. Storm surge levels should drop to around 2.1-2.6 ft by dawn on Sunday. However, homeowners should be concerned about the total water level (storm tide), not just the level of storm surge.


Predicted water levels at Atlantic City, New Jersey from Jan 21-24. The greatest threat to coastal flooding will be during two high tide cycles on the evening of Sat Jan 23 and morning of Sun Jan 24. Original plot from www.tidesandcurrents.noaa.gov.


Predicted water levels at Cape May, New Jersey from Jan 21-24. The greatest threat to coastal flooding will be during two high tide cycles on the evening of Sat Jan 23 and morning of Sun Jan 24. Original plot from www.tidesandcurrents.noaa.gov.


I created a table (below), in which I predict storm surge and total water levels (surge + tide) at Atlantic City and Cape May. The timing and height of predicted tide levels come from NOAA Tides and Currents. Water levels are in height above Mean Lower Low Water (MLLW).

The storm surge predictions are my own and added to the predicted astronomical tide.  For surge prediction I used the "Hurricane Hal's Secret Rocket Ship Model," which is basically my intuition after working with surge data for eight years now. But, hey, everyone likes thinking about rocket ships, right?

These are "deterministic" predictions (not probabilistic), meaning I'm sticking my neck out there and trying to make an "exact" forecast, and not considering the likelihood or unlikelihood of my prediction. I'm not doing advanced modeling here, so please account for a margin of error (yay- disclaimers!)

ATLANTIC CITY

  DATE          TIME     EVENT                   PRED TIDE     SURGE      TOTAL WATER
 Sat Jan 23   5:06PM   Lower High Tide      3.79ft                 3.0 ft            6.79ft (MLLW)
Sun Jan 24   7:30AM  Higher High Tide     4.76ft                 2.3 ft             7.06ft (MLLW)

CAPE MAY

  DATE          TIME     EVENT                   PRED TIDE     SURGE      TOTAL WATER
 Sat Jan 23   8:18PM   Lower High Tide       4.63ft                 3.2 ft            7.83ft (MLLW)
Sun Jan 24   8:36AM  Higher High Tide       5.63ft                 2.4 ft            8.03ft (MLLW)

These water levels would cause minor to moderate coastal flooding near the time of high tides.


Comparison to Previous Events
I do not expect that this surge event will be one for the record books. Although the winds will be howling from late morning until after dark on Saturday, the duration of this wind event will not be long enough to really get a big surge setup. So in places like coastal New Jersey, don't expect water levels to approach historical levels reached by Hurricane Sandy or even the 1962 Ash Wednesday Storm.

When we compare historical storms, we see there is a difference in surge potential from storms that ride up the coast and those that pull off the coast. A nor'easter or hurricane riding up the coast will generate longer-duration onshore winds than a storm pulling off the coast, like Jonas.

That said, water levels may approach or slightly exceed those reached this past October from the "October Pressure Gradient Surge." Although all surges occur from pressure gradients, the event in October was amazing because of the geographic scope of the event. A widespread pressure gradient between Hurricane Joaquin in the Bahamas and a strong high pressure system parked over Eastern Canada caused four days of prolonged, strong onshore winds.

The pressure gradient between Hurricane Joaquin and a strong area of high pressure created a prolonged onshore wind event in October. Although winds may be stronger this weekend, it will be a shorter duration event. Image: http://moe.met.fsu.edu/tcgengifs/, edited by Hal Needham.

During the October event, storm surge levels above predicted astronomical tides reached 2.51 ft in Atlantic City and 3.08 ft in Cape May. The total water level (surge + tides) above MLLW reached 7.11 ft in Atlantic City and 8.04ft in Cape May.

These surge levels were high enough to cause minor to moderate coastal flooding along the Jersey Shore, particularly near Ocean City, Sea Isle City and Avalon. I came across powerful waves washing across the causeway of Avalon on the afternoon of Sun Oct 4.

Powerful waves crashed over this seawall on the north end of Avalon, New Jersey, on the afternoon of Sun Oct 4. I was trying to drive from Avalon to Ocean City, but I could not pass this location. Photo: Hal Needham.

The chart above shows that I am predicting similar total water levels this weekend. I think total water levels will be similar because it takes time to move a lot of water. Although winds this weekend should reach higher levels than in October, the duration of sustained winds greater than 30 mph should only last about 24 hours, whereas October's gradient event produced prolonged onshore winds (25mph+) for 3-4 days.


Storm Surge Impacts
Although I'm predicting similar water total water levels to October's event, coastal flooding impacts could be worse in some locations this time for two reasons:

1. Wave heights may be higher. It takes time for wind to displace a column of water in the ocean, but surface wind waves often generate more quickly. As sustained winds over open ocean could top 50mph, with gusts in the 70s, massive waves will pummel the coast. So waves riding on surge inundation could do considerable damage.

2. October's storm surge produced moderate coastal erosion in New Jersey. After the surge subsided, I personally found 7 ft (2.13 m) cuts in Sand Dunes in the town of Avalon. A lot of sand and grass washed away, and there has not been time for natural or artificial beach nourishment. Therefore, similar storm tide levels this time may flood areas not flooded in October.

October's Gradient Surge along the Jersey Shore cut 7-ft (2.13-m) faces into sand dunes in Avalon, NJ. I am standing next to one of these cuts on Mon Oct 5. (Photo: Hal Needham).


Social Surge
Want to interact on social media about Winter Storm Jonas' storm surge/ coastal flooding? Check out the forum I created at the new U-Surge Project.

www.u-surge.com

Go to Resources - Forums - Current Flood Event

Post your thoughts or questions about this surge event and let's get the party started!

Take care and stay safe everyone!

-Hurricane Hal