Wednesday, August 30, 2017

Horrors Beyond Horrors Unfolding in "Golden Triangle" of Beaumont- Port Arthur- Orange, Texas


Torrential rains have pounded the Beaumont-Port Arthur-Orange region for the past 9-12 hours. This will continue for atleast three more hours. Rainfall rates have approached 4-6" per hour in the heavier cells. Radar image: Weather Underground WunderMap


Horrors beyond Horrors-

I will make this a quick post. The worst conditions faced in Harvey unfolded overnight and is still unfolding this morning in the "Golden Triangle" of Beaumont- Port Arthur- Orange.

Harvey made a second landfall near here, and torrential rain has been literally spinning over the same areas for 9-12 hours now. Rainfall rates have reached 4-6 inches an hour at times.

Extreme rainfall knocked out dish-tv and other utilities. Many quickly became cutoff from most information sources.

I set up Facebook group to connect people and 800+ joined within 2 hours. The messages have been horrific.

Messages like, "EXTREME CRISIS! THIS IS AN OLDER COUPLE! Just spoke to [Name]. Says water up to shoulders. Will try to get on roof of house."

I promise I am not exaggerating when I say at least hundreds, if not thousands, of people are fighting for their lives right now.

Any rescue equipment- particularly boats- are desperately needed right now. Worst hit areas over night seem to be Nederland and Port Arthur- but extremely bad in Beaumont and points north now.

Even if you are in Arkansas, Louisiana or Mississippi, if you can get a boat to this area, I guarantee that there will be more people than you could possibly rescue two days from now. Normally a major response would be launched for Beaumont-Port Arthur-Orange, but regional resources are strained with Houston under water. Also, it's not possible for help to arrive here from the west because it's impossible to travel from west-to-east across Houston.

The scale of this is incomprehensible. It's as if the entire states of Connecticut and Rhode Island are submerged and two or three counties are fighting for their lives.

We aren't hearing these people crying out because they have no voice. Many have lost power, in the best case have made it to a roof. The eyes of the world are on Houston and these smaller cities in southeast Texas are crying out and nobody can hear them.

-HurricaneHal

Tuesday, August 29, 2017

U-Flood Project Provides Near-Real Time Flood Mapping from Hurricane Harvey


Galveston-based Tailwind Labs and Marine Weather and Climate have launched the U-Flood Project to provide near real-time mapping of flooded streets during Hurricane Harvey. Link: www.u-flood.com

The project provides a crowdsourced mapping platform for the Houston metro area, as well as the I-45 corridor, Galveston, Beaumont/ Port Arthur, Lake Charles, Baton Rouge and New Orleans.

Real-time mapping is crucial right now as first responders are still in rescue mode- trying to locate and save flood victims.

Here's how you can help:
1) Map it: Click on a city image and start mapping flooded streets. Even if you just map the street in front of your house, the collective effort of thousands of users will construct a near-real time map of current flooding!

2) Tell others: Tell everyone you know to use U-Flood on their phones or computers.

3) Donate: Please consider donating to this project on Patreon so we can keep expanding our resources as this catastrophe unfolds. We have a donate button on the bottom of the U-Flood homepage. Even a $10 gift will help so much!

Thank you!
-Hurricane Hal

Monday, August 28, 2017

Harvey "Round 3" Starts Today

HURRICANE HARVEY UPDATE
MON AUG 28 630AM CENTRAL TIME
Main Point: Harvey “Phase 3” Starts today!
Perspective:
Phase 1: Fri Aug 25: Extreme wind damage near Rockport and moderate storm surge along Central TX coast;
Phase 2: Sat Aug 26-Sun Aug 27: Extreme, persistent rainfall causes catastrophic flooding, particularly in metro Houston and along I-45 corridor SE of Houston;
Phase 3: Mon Aug 28-Tue Aug 29: Strong winds build in metro Houston, I-45 corridor SE of Houston, Galveston area and Houston-Beaumont corridor. Banding of extreme rainfall rates and isolated tornadoes shifts east to Beaumont-Lafayette corridor

Timing:
Developing Monday morning through Tuesday night

Hazards:
-Strong winds developing in Houston-Galveston corridor, Galveston Island, Bolivar Peninsula Houston-Beaumont corridor;
-Persistent, moderate rain, with isolated downpours in metro Houston and I-45 corridor SE of Houston
-Heavy banding/ training of rain, with embedded tornadoes, shifts east to Beaumont/ Port Arthur through Lafayette, LA
-Storm surge levels build in Galveston/ Galveston Bay, Bolivar Peninsula, to Cameron, LA. Not expecting a huge surge, but water levels could be 2-4 feet above normal. This will impede the runoff of torrential rains.
-Massive runoff of torrential rainfall will keep bayous/ creeks/ rivers rising...rain has stopped in Conroe-Liberty region, but torrential rain to north will drain through this area and rapidly rise creeks, bayous and rivers

Impacts:
-Widespread power outages for Houston/ Galveston corridor, east through Beaumont/ Port Arthur. This includes Galveston Island, which has not experienced the most severe impacts of this storm yet;
-Widespread wind damage for Houston/ Galveston corridor, east through Beaumont/ Port Arthur. Nothing like the damage to Rockport area from hurricane-force winds. The winds from Harvey over next two days may exceed 40mph sustained with gusts to 60mph;
-Expect considerable tree falls in Houston-Galveston corridor and Houston-Beaumont corridor, as trees are now rooted in soggy soil and have been stressed for days;
-Expect scattered roof damage and collapse of less sturdy construction, like carports and awnings over gas station pumps...some flying debris possible;
-Very rapid flash flooding from new squall lines, especially from Beaumont/ Port Arthur east through Lafayette

Take Action:
-Prepare to lose power, particularly in Houston-Galveston and Houston- Beaumont corridors, including Galveston Island;
-Expect power could be out for at least several days, as many places are cut off (including Galveston Island) and power crews cannot access them;
-Expect tree falls in this same region. Watch your proximity to large trees and branches- if possible stay "upwind" from large trees;
-Have a flashlight and, if possible, battery-powered radio near you;
-From Beaumont/ Port Arthur through Lafayette, LA keep an eye on squall lines and prepare for isolated tornadoes.

Stay safe everyone....hazardous weather will continue in the region until at least Tuesday night!

-Hurricane Hal
hal@marineweatherandclimate.com

Saturday, August 26, 2017

Perspective on Harvey's Storm Surge and Widespread Flood Threat

Hurricane Harvey made landfall near Rockport, Texas, as a category-4 hurricane yesterday evening. This blog post provides some insights on Harvey's storm surge and widespread flood threat.


Highest Surge

Harvey's highest storm surge occurred east of Rockport. We should expect a long-term, severe storm surge as far east as Matagorda Bay, where strong onshore winds are continuing to push a substantial storm surge into places like Port Lavaca.

A NOAA Tides and Currents gauge at Port Lavaca, Texas, reported an observed storm tide level of 7.0 feet above Mean Sea Level (MSL) at 3:48AM Central Time. Unreported storm tides in this region likely reached as high as reached 10-12 feet.

Harvey's storm surge and torrential rains are flooding a widespread area of the Central Texas Coast and portions of inland Texas. Image: ABC News


Port Lavaca

Harvey has generated the highest storm surge at Port Lavaca since Hurricane Carla (1961). However, Harvey's storm surge level in this area is not as rare as we might believe, and it may come in 5th place for all surges since 1919. What's exceptionally rare about Harvey is that this storm surge will combine with a stalling storm and tremendous rainfall, which will generate catastrophic flooding.


Time series of storm tide (surge + tide) levels at Port Lavaca above Mean Sea Level (MSL) from 1900-2017 (118 years). Hurricane Harvey likely generated a 10-12 foot storm tide near Port Lavaca, although the highest observed level reported was 7.0 feet above MSL on Sat Aug 26 at 3:48AM CDT. Harvey generated the highest storm tide at Port Lavaca since Hurricane Carla in 1961, and the 5th highest storm tide since 1919. Observations are graphed chronologically from oldest (left) to newest (right). Absence of low-magnitude storm tide events before Ella (1958) is influenced by under-reporting, and does not necessarily indicate a lack of actual storm tide events. 


Compound Flooding

To the east of the storm center, onshore winds will keep storm surge levels elevated and impede the drainage of heavy rainfall. This will be a major problem, as Harvey is forecast to dump 20 or more inches of rain across a widespread area over the next week.


NOAA QPF Rainfall forecast map depicts 20 or more inches of rain across a widespread area over the next week.


Highly Variable Storm Surge Levels

Storm surge levels closest to Harvey's center of circulation will be highly variable, depending upon wind direction. As Harvey is forecast to drift for several days, a change in the center of circulation by even a few miles can change the wind direction from offshore to onshore in places. Areas closest to Harvey's circulation center may see rapid water level rises and falls as wind direction changes from offshore to onshore, and vice-versa.

For example, the storm surge level was about 1 ft below normal at Rockport around 2:00AM today, but then began rising rapidly to around 0.8 ft above normal by around 3AM, when the tide gauge failed.


Water levels in places like Rockport, Texas, have been highly variable. Areas closest to Harvey's circulation center may see rapid water level rises and falls as wind direction changes from offshore to onshore, and vice-versa. The red line in this graph is observed water level and the blue line is predicted water level, based on astronomical tides. Source: NOAA Tides and Currents.


Houston/ Galveston/ Freeport

Farther east from the center of circulation, around the Houston/ Galveston/ Freeport areas, expect persistent onshore winds with strong squalls today. The squalls will likely be separated by periods of multiple hours with no rain. Depending on Harvey's track, onshore winds and rainfall may increase in this area from late Sunday through Tuesday, which would increase flood potential.

Tornadoes most often are spawned in these bands well east of the circulation. Hurricane Carla (1961) made landfall in the Port Lavaca region, but generated several powerful tornadoes that caused substantial damage in Galveston.


Strong squalls of rain and wind will occur east of Harvey's circulation center. Such squalls produce torrential rain and sometimes spawn tornadoes. Image: Weather Underground Wundermap- accessed Fri Aug 25, 2017.

If Harvey tracks northeast after stalling, the threat of strong onshore winds and heavy rainfall will increase in this region. Prolonged onshore winds even below tropical storm force could elevate places like Galveston Bay by several feet for multiple days. Even a modest storm surge in this area could exacerbate flooding, as a prolonged storm surge of 2-4 feet in Galveston Bay will impede the drainage of torrential rainfall.


Larger Perspective on Coastal Flooding and Extreme Events

Harvey has struck an area that has observed multiple major hurricane strikes and storm surge events in the past century. Prior to Harvey, four hurricanes have generated storm surges of at least 13 feet at Port Lavaca, but none since Hurricane Carla (1961), 56 years ago.

Harvey is a classic example of why we need to know our hurricane history. From a storm surge perspective, this event may seem exceptional along the Central Texas Coast, but in the bigger picture it may end up more like a 20-25 year storm surge event (surge level we should expect every 20-25 years on average). Again, what is truly exceptional about Harvey is the likelihood of it stalling and dumping tremendous rainfall, which will be coupled with a long-term storm surge.

Harvey is striking one of four areas along the U.S. coastline that concern me because they have observed severe hurricanes and storm surges in the past, but not in recent history. Here are the areas that concern me most:

1) Georgia and Southern South Carolina:
This area observed hyperactive hurricane strikes and severe storm surges in the late 1800s, but nothing of that magnitude since 1898. The area south of Charleston concerns me the most, because they were on the "weak" side of Hurricane Hugo (1989) and did not experience Hugo's massive surge.


The Great Hurricane of 1898 generated a 16-ft (4.88 m) storm surge at Brunswick, Georgia, completely devastating the harbor.

2) Palm Beach/ Fort Lauderdale, Florida:
This area observed large surges in 1928 and 1947 and has had many near misses. Hurricanes Frances and Jeanne, both in 2004, made landfall just north of this region, keeping it on the weaker side and forcing the strongest winds to blow offshore. Hurricane Andrew (1992) was a powerful, but geographically compact hurricane the made landfall south of Miami and did not generate substantial surge in Fort Lauderdale or Palm Beach.


The 1947 Hurricane smashed the coastline of Palm Beach County with a powerful storm surge. This photograph of the Seacrest Hotel in Delray Beach was taken at the northwest corner of Ocean Boulevard and Atlantic Avenue. Image Courtesy: Florida Memory: State Library & Archives of Florida. (https://www.floridamemory.com/items/show/38352).

3) Florida West Coast, especially Tampa/ St. Petersburg:
This area is setup for a massive storm surge event with an astronomical impact because the bay is highly developed, with relatively minor flood protection. Storm surge models suggest a surge exceeding 20 ft (6.1 m) could strike the bay, if a hurricane tracked in from the southwest and made landfall north of St. Petersburg/ Clearwater.

Two hurricanes struck the area in 1848, both generating surges that exceeded 10 ft. The last substantial storm surge in this region occurred in 1921, when a hurricane generated a 10.5 foot surge.


4) Central Texas Coast:
Hurricane Harvey is currently striking the fourth region that concerns me.

Port Lavaca had observed four storm surges exceeding 13 ft in the past century, but nothing higher than 6.9 ft since 1961.

Corpus Christi, the largest city along the South-Central Texas Coast, shares a disturbing history of hurricanes and storm surges. The city has observed seven storm surges that have exceeded 7.9 ft in the past 102 years, or about 1 surge every 15 years over that threshold. But none of them have occurred in the past 37 years, since Hurricane Allen in 1980.


Corpus Christi has observed  7 storm surges that have exceeded 7.9 feet in the past 102 years, but none since Hurricane Allen (1980), which struck 37 years ago. 

Long periods of relative calm often lead us to underestimate our risk.

As I told a reporter on the phone yesterday, our foremost problems are public perception and lack of awareness. Once we truly understand our risks, widespread support for coastal protection rapidly increase, and funding these projects follows.

Notes: I usually write well-referenced articles, but as Harvey is impacting our area, I do not have time to add references/ citations right now to this blog. If you have any questions about Harvey or anything related to coastal flooding in general, shoot me an email and I will try to get back to you ASAP.

For the most frequent updates, check out the U-Surge Hurricane Harvey page: https://www.u-surge.net/hurricane-harvey.html.

Thunder starting again and lights flickering, so I guess that means I'm done here!

I hope I can access email on my phone.... contact me at: hal@marineweatherandclimate.com

Stay safe, much love, and thanks for reading!

-Hal


Friday, August 25, 2017

Harvey's Compound Rain/ Surge Flooding Could be Catastrophic and Underestimated- Especially along the Houston-Galveston Corridor

MAIN POINTS:

1) All eyes are on Hurricane Harvey striking the central Texas coast, but many may underestimate the risk of compound (surge/ rain) flooding to the east, in areas like the Houston-Galveston corridor;

2) Prolonged moderate storm surge in Galveston Bay will impede the drainage of tremendous rainfall inland and along the coast;

3) Harvey may flood some areas of metro Houston that did not flood in Allison (2001), the Memorial Day Flood (2015) or the Tax Day Flood (2016);

4) Harvey may flood some areas near Southeast Houston/ Galveston Bay that did not flood in Ike (2008), including parts of Pasadena, Clear Lake, Webster, Nassau Bay, League City, Dickinson, Kemah and Seabrook;

5) Harvey will likely generate substantial flooding in Galveston, but it is less likely that water levels will exceed Ike (2008);

6) Harvey will likely generate substantial flooding on Bolivar Peninsula, but will NOT likely rival the height or power of Ike's surge;


DISCUSSION:

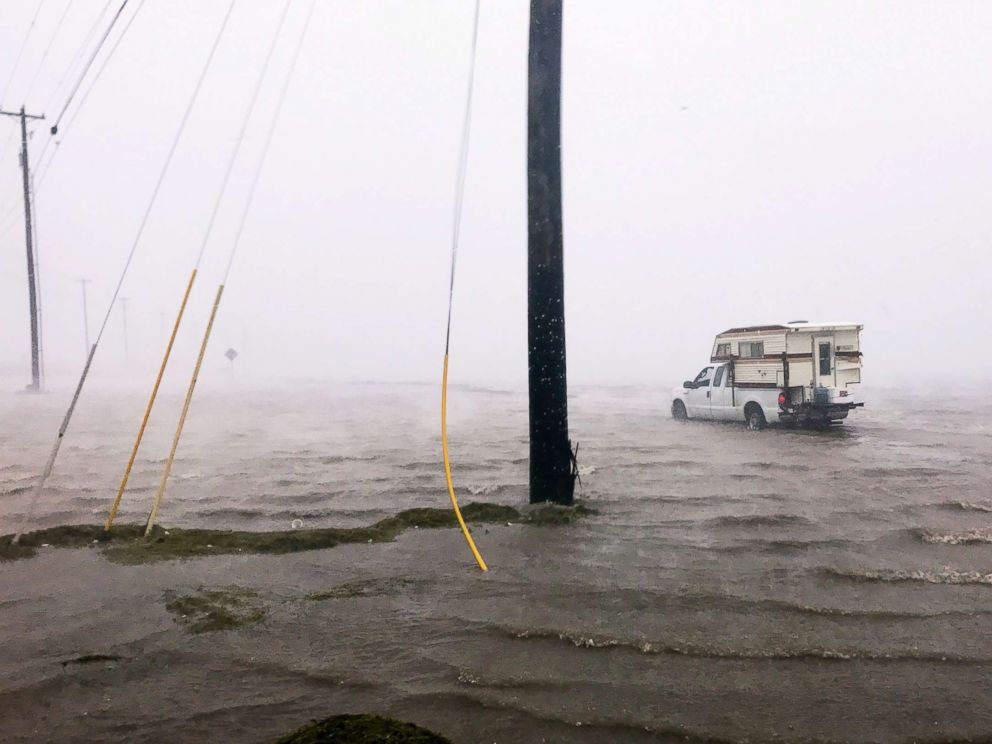
As Harvey approaches Texas, all eyes are on the central coast from around Corpus Christi to Sargent. Harvey is forecast to make landfall as a major hurricane in this region with maximum sustained wind speeds exceeding 110 mph and a storm surge of 6 to 12 feet.

However, this is just the beginning of a saga that could last the better part of a week.

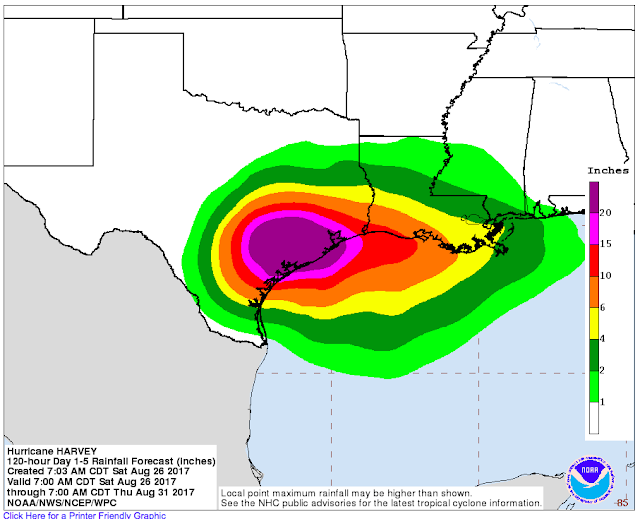
After Harvey arrives near the coast, it is likely to stall or slowly drift for days. This will enable Harvey to dump tremendous amounts of rain in a widespread area along the Texas coast and inland. NOAA's Quantitative Precipitation Forecast (QPF) map below depicts the potential for a widespread area along the coast and inland to receive 10 or more inches of rain, with an impressive band of 20" plus from near Port Aransas to High Island.


NOAA's Quantitative Precipitation Forecast (QPF) map forecasts a widespread area of rain to exceed 15 inches in the 7-day period from Thu Aug 24 to Thu Aug 31. Source: National Hurricane Center Fri Aug 25 0400AM CDT


These tremendous rainfall totals are supported by various reliable models. For example, the GFS model run from Aug 25 at 0000z (Thu Aug 24 at 7PM CDT) depicts a widespread area of rain exceeding 20" along the coast and inland in southeast Texas.

GFS rainfall potential from Thu Aug 24 at 7PM CDT to Wed Aug 30 at 7PM CDT. Yellow areas depict areas exceeding 20" of rain. 


If these forecasts of Harvey's rainfall are verified, the rain coverage will dwarf Tropical Storm Allison's (2001) rain coverage, at least in southeast Texas. Allison generated heavy rainfall in Louisiana, Mississippi and other states after weakening to a tropical depression and then a subtropical low. The map below depicts the east-west extent in Texas exceeding 12 inches of rain extended from approximately Houston to Beaumont.

Observed precipitation from Tropical Storm Allison (2001). Map courtesy Southern Regional Climate Center at Louisiana State University.


However, extreme rain events often generate localized areas with higher totals, and, unfortunately, Allison generated several pockets of extreme rainfall in the metro Houston area. The Harris County Flood Control District map below depicts a swath of rain exceeding 30" in east and northeast Houston, and even areas in downtown and southwest Houston, like the Medical Center, observed tremendous rainfall that caused substantial damage.

Yet, even on this more localized map, we get the sense that Allison's rainfall was not as widespread as the forecast rainfall for Harvey. For example, in the western portion of Harris County, west of Katy, Allison's observed rain was less than 5".


Map of Allison's rainfall in Harris County, Texas, from the Harris County Flood Control District


Allison's tremendous rains caused widespread flooding in Houston


Fortunately, Allison's life as a tropical storm was short-lived. It was only a tropical storm for around 14 hours, according to the track map below from Unisys Corporation. However, after weakening to a depression it drifted near the Houston metro area and dumped copious amounts of rain.

Allison's short life span as a tropical storm provides an important ingredient in this story. Tropical storms and hurricanes need time to build up storm surges, and Allison did not have enough time to build a large surge.

Tropical Storm Allison tracking map from Unisys Corporation. The yellow segments represent center of circulation while Allison was a tropical storm. 


Allison's speak storm surge at Galveston's Pleasure Pier only reached 3.42 feet above Mean Sea Level. At Morgan's Point, on the inside of Galveston Bay, near Laporte, Allison's storm tide (surge + tide) reached 3.74 ft above Mean Sea Level, but only remained above 2.0 feet for less than 15 hours. Basically, Allison produced a minor surge that came and left quickly, which enabled the tremendous rains in places like Harris County to drain into Galveston Bay relatively unimpeded.


Data Plot: NOAA Tides and Currents
Mark-up: Dr. Hal Needham


Hurricane Harvey threatens to generate a prolonged storm surge event along the central and upper Texas coast. As Harvey is forecast to stall near the central Texas coast, and the circulation around hurricanes is counterclockwise, locations like Freeport, Galveston, Galveston Bay and Bolivar Peninsula will observe days of strong onshore winds.

Although the latest National Hurricane Center advisory (issued at 4AM CDT) depicts Harvey eventually moving east as a tropical storm, after stalling for several days along the central Texas Coast, the text forecast and forecast discussion suggest that we should not focus on the exact track- or intensity. If Harvey re-emerges into the Gulf of Mexico it could strengthen as it travels east....passing by places like Galveston with hurricane-force winds possibly on Tuesday night.

The latest forecast discussions indicate that it is too early to tell if Harvey will re-emerge into the Gulf as it tracks east. There is a fine line between drifting just inland and drifting off the coast. The best we can tell for now is that Harvey will probably drive near the coast.


The latest runs of the GFS and ECMWF models, which are among the most reliable global models, suggest that Harvey may indeed re-emerge into the Gulf of Mexico after stalling....and gain strength as it tracks east early next week.

This potential scenario, which is becoming more likely, would result in Galveston Bay being elevated with at least several feet of storm surge for a prolonged period- possibly days. If Harvey's passes closet to Galveston as a hurricane, it's powerful right eyewall would push considerable water into Galveston Bay.

The Aug 25 0000z ECMWF model run (Aug 24 7PM CDT) indicates Harvey could strengthen as it tracks along the coast next week. This model shows potential position and minimum air pressure at 700PM CDT on Wed Aug 30.

The collision of these ingredients looks like a train and car headed for an intersection on the tracks.

If Galveston Bay is raised by several feet for many days, and a wide area of Texas real estate receives 15-20 or more inches of rain, where is that rain going to go? Runoff into Galveston Bay and Galveston Harbor will be severely impeded and this will create a catastrophic compound flood event.

To make things worse, Harvey's torrential rain coverage should extend considerable distance inland. This water needs to drain somewhere. It will head for the coast. This means that coastal communities near rivers or inland bayous will experience the complex and unusual situation of massive quantities of water coming from three directions:

1) Storm surge (salt water) from the Gulf of Mexico and bays/ inlets;
2) Massive riverine discharge from inland flooding;
3) Massive local rain from above;

Catastrophic compound (rain/surge) flooding may occur where storm surge impedes torrential rains from running off into places like Galveston Bay. The yellow area depicts a battle ground where fresh water and salt water could collide. 

The graphic above shows a possible scenario where storm surge would impede heavy rainfall runoff. The yellow region, labeled "battleground" is not an actual flood plain for flood zone, but just a generalized area of heightened flood risk.

Major and catastrophic flooding could potentially occur across a widespread area of Texas. It's a simplified graphic to demonstrate what happens when incoming surge and outgoing rainfall runoff meet. There's nowhere for the water to go....but up.

The National Hurricane Center has launched products to help us discern the risk of storm surge flooding, and these products, along with the newly released storm surge watches and warnings, are welcome innovations that will improve decision making.

However, these products would be even more effective if they provided the potential for actual water levels- not just storm surge.  For example, on the map below, shaded areas display the storm surge height that has about a 10% chance of being exceeded through Mon Aug 24 at 400AM CDT.


The Good:
1) This geo-spatial (mapped) product is high resolution (zoomed-in) and provides practical information that will help decision making;

2) The map clearly states what it is mapping- the area with at least a 10% chance of storm surge (salt water) flooding;

The Bad:
1) This map only extends until 400AM on Monday. It is likely that Harvey's highest surge levels will arrive after that time near Galveston Bay;

2) Even if this map captured the peak surge levels, it only maps the potential extent of storm surge (salt water) inundation. It tells us nothing about compound rain/ surge flooding, which, in Harvey's case, may be catastrophic.

Although compound flooding is complex, such products could  clarify that they only represent salt-water inundation and that actual fresh/salt water levels may be considerably higher. Otherwise, we get the impression that flood water will mostly stay near the bayou and inlet channels. However, if this region and regions inland receive 15-20 or more inches of rain and the bay, inlets and channels are at bank-full with salt water, much of this map will be submerged under freshwater.

If I'm a homeowner in League City, Texas, I don't care so much if freshwater or saltwater is inundating my home. I just want to know the likelihood of flooding.

From my understanding, local authorities issue evacuation decisions based on such official products, so a mis-communication of flood risk at the "top" disseminates to the general public. From personal correspondence with people in the western communities of Galveston Bay, most people are staying put and getting supplies ready, but not anticipating flood levels could come anywhere near Ike.

However, compound flooding has the potential to flood locations that did not flood during Ike and inflict a widespread and long-term catastrophe that could last into the better part of next week.

OTHER PRECEDENTS:

Tropical Storm Debby (2012) and Hurricane Isaac (2012) provided fairly recent examples of the power of compound flooding along the Gulf Coast.

Debby generated substantial flooding in western Florida, including the Tampa/ St. Petersburg area, where heavy rainfall could not drain effectively into Tampa Bay.

Hurricane Isaac generated compound rain/surge flooding that inundated some communities near New Orleans that had not flooded during Hurricane Katrina.

Hurricane Isaac generated a much greater compound flood. Isaac shocked locals when it flooded some areas near New Orleans that did not flood during Hurricane Katrina (2005). However, Isaac raised the level of Lake Pontchartrain at Mandeville for than 3.28 ft (1 m) for 68 consecutive hours (Veatch 2015). The elevated Lake level impeded widespread rain exceeding 10 inches, causing substantial flooding in places like Laplace, where as many as 4,000 water rescues were required (Berg 2013).

Harvey threatens to inflict a catastrophic flood event that far surpasses previous examples.

This blog post focused on areas that are receiving water from three directions- salt water surge, riverine flooding from inland and heavy rainfall from above. Galveston Island and the Bolivar Peninsula don't experience river drainage, so they don't quite fit the example. It is highly unlikely that the Bolivar Peninsula will experience anything rivaling Ike, because Ike leveled the Peninsula with a fast-moving surge reaching at least 17.5 feet (Berg 2010).

I've seen substantial street flooding in downtown Galveston at least five times in the past 18 months. I would expect substantial flooding on the island, particularly north of Broadway....perhaps rivaling Ike in some places IF all the ingredients come together and Harvey remains strong as it tracks east.


SOME FINAL THOUGHTS:

1) This blog post focused considerably on the Houston/ Galveston corridor. The main idea of the post could be applied elsewhere- compound flooding will likely impact a huge area of coastal Texas and possibly even SW Louisiana;

2) I focused much of this blog post on areas well east of the forecasted landfall zone, because I felt that the flood risk is underestimated by most people. Closer to the location of landfall people are likely more aware of their actual risk;

3) Harvey is forecast to be a long-term event, with conditions deteriorating along the Texas Coast throughout the day on Friday. If you are threatened by storm surge, rainfall or compound (surge/ rain) flooding, take precautions immediately. If you live in the areas mentioned in this blog post, prepare yourself for inundation, even if your home never flooded before;

4) I have received many messages requesting evacuation advice in the past 36 hours. I could not reply to most of them. In general, I like informing people about potential risks and then letting them make their own decisions. The idea of this post is to arm you with information, not tell you if you should evacuate or not;

5) If you find yourself in a flood zone, beware of severe hazards in the water. This is such a widespread flood that numerous pests (snakes, spiders, fire ant colonies) will float on the water and try to find dry ground. The water near you could be severely polluted with chemicals, sewage of other hazards. Cuts exposed to flood water can easily get infected and require immediate medical attention;

6) I am not trying to hype up this situation. I am a huge fan of the National Weather Service and National Hurricane Center. I grew up listening to NOAA Weather Radio every night. I have had the sincere pleasure of working closely with colleagues and friends that are affiliated with NOAA. I love the new products that the National Hurricane Center is rolling out, but I felt I needed to explain how the surge inundation product could be misinterpreted and threaten people's lives. Even if you never heard of this product before, it is likely that your local officials are using this information as guidance. I respect that. We have amazing local authorities in SE Texas. I just felt I needed to speak out;

7) I am writing this blog post because it passed the "grandma" test. I asked myself if my grandma lived in a high compound-flooding risk area if I would speak up, and then I realized I would be going to her house immediately and urging her to take precautions. If my grandma lived in SE Houston, Galveston, Bolivar, or any of the communities west of Galveston Bay, I would feel uneasy about her safety during this long-duration storm and feel much better if she evacuated at least north or west of Houston;

8) I hope more than anyone that this catastrophic scenario does not pan out. If you want to talk about all this after the storm passes, give me a shout, and we'll get can get together.

Ok, it's 4:49AM on Friday morning and I'm finally going to bed for a few hours. I will re-emerge later this morning.

Take care, everyone. This is a long-duration storm, and for many areas, especially east of landfall, the worst may not arrive until Tuesday, or even Wednesday.

-Hurricane Hal


REFERENCES:


Berg, R., 2010: Tropical Cyclone Report, Hurricane Ike. The National Hurricane Center, Miami, Florida, United States. Report made available on the Web at: www.nhc.noaa.gov/pdf/TCR-AL092008_Ike_3May10.pdf.


Berg, R., 2013. Tropical Cyclone Report, Hurricane Isaac. Miami, Florida: Technical Report for The National Hurricane Center, 78p.