
Tropical Storm Hermine made landfall in extreme Northeast Mexico at approximately 8PM (local time), September 6, 2010. The storm quickly tracked into South Texas, producing torrential rains, wind damage, and some minor coastal flooding from the onshore flow. Here's an interesting surge-related article posted on the National Weather Service Brownsville, TX Webpage.
Link:http://www.srh.noaa.gov/bro/?n=2010event_herminesurge
[start of quote]
Tropical Storm Hermine
Storm Surge Summary
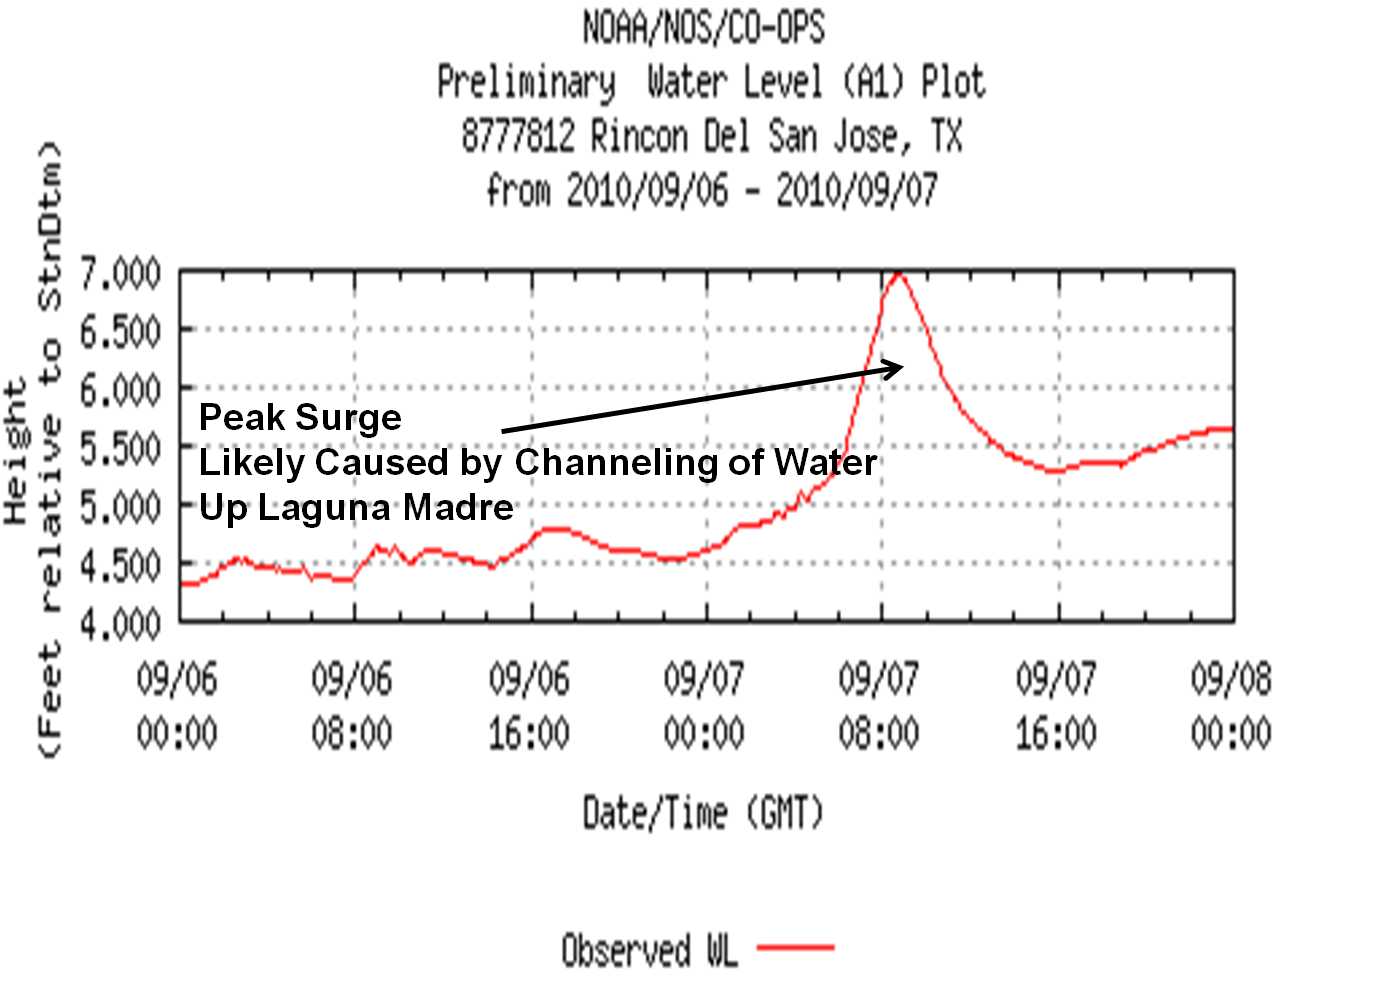
Peak Water Rises Occur at Low Tide, but Impacts Felt in Channels
Rapidly increasing winds turning from east to south as the center of Tropical Storm Hermine scooted across Cameron, Willacy, and into western Kenedy County overnight on September 6th and 7th brought a push of water onto the beaches and into the Brownsville Ship Channel. For primary residential and beach areas, the push occurred near low tide (first two graphs below), which produced no inundation issues, but water was able to reach the dune line and shut down vehicle traffic at public beach access points beginning during the afternoon of the 6th and continuing overnight.
More interesting is what occurred when the water was forced through the thinning Laguna Madre and the Brownsville ship channel. The third graph below shows a much larger spike in water levels at Rincon del San Jose (Kenedy County) where the Laguna Madre runs through sand, salt, and mud flats on its way to Baffin Bay. Data suggest that a surge perhaps as high as 4 feet occurred during the pre dawn hours of September 7th, near the time of high tide. Reports from the Port of Brownsville indicated heavy wave action within the channel, with waves breaking over channel barriers around the time of Hermine’s passage to the west. [end of quote]
Although the preceding account mentions the possibility of a 4-foot surge at Rincon del San Jose, TX, the graph appears to show less than 3 feet of water rise. A second graph, obtained from NOAA Tides and Currents, indicates water levels at the same location between Sept 4 and Sept 9, indicates that maximum water levels peaked less than 3 feet above normal conditions during Hermine. Sometimes water gauge data is adjusted and "cleaned up" in the quality control process, to remove potential errors, which may explain the difference in units between these two graphs.
Nonetheless, the NWS office at Brownsville posted a nice storm archive on their Website, which contains a storm overview, radar loops, wind and rain tables, as well as information on the storm surge. This type of information is valuable after a storm passes.
Thank you for suggesting good ideas.
ReplyDeleteSa gaming สมัคร
I have found that this site is very informative, interesting and very well written. keep up the nice high quality writing Mold Testing Bristol
ReplyDelete